import pandas as pd
import requests
import seaborn as sb
import matplotlib as pltBlack bear hunting activity and harvests - Open Ontario
Regression
Time Series
Open Ontario
CKAN API
Software:Python
Software:R
Data Provider
The provincial government of Ontario provides open access to thousands of data sets via their Open Data Ontario portal. The purpose of sharing all data documents with the public is to remain transparent and accessible. More details about the data license, training materials, and other information can be found here.
Black Bear Hunting Activity
The dataset records numbers of black bears harvested and active black bear license holders every year from 2012 to 2018 in different wildlife management unit (WMU). The WMUs are the administrative coverage area that serves as a land base for wildlife monitoring and management.
The original dataset of bears harvested and active hunters and its supporting document can be found here and you can quickly preview the CSV dataset file here. Moreover, The legend description can be viewed here. Note that we could use a web browser to visit the page, find the appropriate dataset, download it and then load it into R / Python directly, but for reproducibility and to automate reporting when new data is released, we automate the full process using the API.
Libraries
library(jsonlite)
library(latticeExtra)
library(tidyverse)
Using the API to Find the DataStore Resource Id
The Ontario Data Catalogue uses the CKAN API. The CKAN API uses some specific terminology, a CKAN package is a dataset landing page, while a resource is an individual file, table, API-backed data object, or supporting document attached to that dataset.
The CKAN API is similar ot a REST API in that we interface it using a constructed URL and obtain a response. We will use it to search for a dataset and obtain the url to download a csv file.
We use the API to search for the black bear hunting dataset and identify the active CSV resource id needed by the datastore_search API endpoint. Here we’ll search for black bear and see if we can find the data table identifier. Search is performed by adding search terms to the api_base to construct a url. We include a timeout in the request to avoid waiting forever if our internet (or the API) breaks. The API returns a json file search_results with up to 10 rows (user defined value that works here because there aren’t many bear datasets) that needs reshaping to make it easier to read the important values.
api_base = "https://data.ontario.ca/en/api/3/action"
search_terms = "black bear"

search_response = requests.get(
    f"{api_base}/package_search",
    params={
        "q": search_terms,
        "rows": 10
    },
    timeout=30
)
search_response.raise_for_status()

search_results = search_response.json()["result"]["results"]

datasets = pd.DataFrame([
    {
        "name": dataset["name"],
        "title": dataset["title"],
        "resources": dataset["num_resources"],
        "modified": dataset["metadata_modified"]
    }
    for dataset in search_results
])

datasets
name ... modified
0 bear-management-area ... 2025-10-16T18:41:46.993385
1 black-bear-hunting-activity-and-harvests ... 2026-02-12T16:23:39.091050
2 trapper-harvests ... 2026-02-20T14:09:57.042944
3 hunting-and-fishing-licence-issuers ... 2025-10-22T19:18:17.902758
[4 rows x 4 columns]api_base <- "https://data.ontario.ca/en/api/3/action"
search_terms <- "black bear"
search_url <- paste0(
api_base,
"/package_search?q=", URLencode(search_terms, reserved = TRUE),
"&rows=10"
)
search_results <- fromJSON(search_url, simplifyDataFrame = TRUE)$result$results
datasets <- search_results |>
transmute(
name,
title,
resources = num_resources,
modified = metadata_modified
)
datasets name
1 bear-management-area
2 black-bear-hunting-activity-and-harvests
3 trapper-harvests
4 hunting-and-fishing-licence-issuers
title resources modified
1 Bear management area 2 2025-10-16T18:41:46.993385
2 Black bear hunting activity and harvests 4 2026-02-12T16:23:39.091050
3 Trapper harvests 2 2026-02-20T14:09:57.042944
4 Hunting and fishing licence issuers 4 2025-10-22T19:18:17.902758The search results include the dataset name black-bear-hunting-activity-and-harvests. Now that we have the name, it is passed as the value of package_show in the next API call. The return is again in json format with the full metadata for the dataset, including last modification date, data license information, notes (here in both English and French), keywords, and various other resources. Our goal is to make sure that we obtain the right version of the data by finding the resource_id (here it is a seemingly random set of characters that uniquely identify the data and it’s version for use in the API).
package_name = "black-bear-hunting-activity-and-harvests"

package_response = requests.get(
    f"{api_base}/package_show",
    params={"id": package_name},
    timeout=30
)
package_response.raise_for_status()

package = package_response.json()["result"]
resources = pd.DataFrame(package["resources"])

resource_summary = resources[
    [
        "id",
        "name",
        "format",
        "language",
        "datastore_active",
        "data_last_updated",
        "url"
    ]
]

resource_summary
id ... url
0 b6deff62-bb0f-4ad7-a09f-7b9499b9210f ... https://data.ontario.ca/dataset/c14b7d2b-7c42-...
1 7dd6328e-74cc-4291-a041-2345cf7c6186 ... https://data.ontario.ca/dataset/c14b7d2b-7c42-...
2 7d145284-885a-4f71-b587-1a5413ff7b88 ... https://data.ontario.ca/dataset/c14b7d2b-7c42-...
3 ee816857-191b-44f3-8a15-996d3ff8f97b ... https://data.ontario.ca/dataset/c14b7d2b-7c42-...
[4 rows x 7 columns]package_name <- "black-bear-hunting-activity-and-harvests"
package_url <- paste0(
api_base,
"/package_show?id=", URLencode(package_name, reserved = TRUE)
)
package <- fromJSON(package_url, simplifyDataFrame = TRUE)$result
resources <- as_tibble(package$resources)
resource_summary <- resources |>
select(
id,
name,
format,
language,
datastore_active,
data_last_updated,
url
)
resource_summary# A tibble: 4 × 7
id name format language datastore_active data_last_updated url
<chr> <chr> <chr> <chr> <lgl> <chr> <chr>
1 b6deff62-bb0f-… Data… XLSX english FALSE 2021-03-31 http…
2 7dd6328e-74cc-… Blac… CSV english TRUE 2026-02-05 http…
3 7d145284-885a-… Dict… XLSX french FALSE 2021-03-31 http…
4 ee816857-191b-… Acti… CSV french TRUE 2026-02-05 http…For DataStore API calls, choose a resource where datastore_active is TRUE. This reduces the options to English and French CSV files, so although it isn’t necessary to filter by file type, we do so below to flag the step for future reference when multiple file types are provided. The English CSV resource id is the value that will be used for the data download.
datastore_resources = resources[
    (resources["datastore_active"] == True) &
    (resources["format"] == "CSV")
]

english_resource = datastore_resources[
    datastore_resources["language"] == "english"
].iloc[0]

resource_id = english_resource["id"]

resource_id'7dd6328e-74cc-4291-a041-2345cf7c6186'datastore_resources <- resources |>
filter(datastore_active == TRUE, format == "CSV")
english_resource <- datastore_resources |>
filter(language == "english")
resource_id <- english_resource$id
resource_id[1] "7dd6328e-74cc-4291-a041-2345cf7c6186"A Few Notes
To make sure these instructions are as transferrable as possible, here are a few terminology tips.
The dataset URL is the general purpose web page for a package, such as this for the Black Bear Hunding Activity and Harvests page https://data.ontario.ca/en/dataset/black-bear-hunting-activity-and-harvests. The package name is the last part of that URL, black-bear-hunting-activity-and-harvests. This acts as a package identifier. Use it with package_show API call. The resource id is the identifier for a specific file or table inside that package. Use it with datastore_search only when that resource has datastore_active == TRUE.
If you already have a dataset URL from hunting around the webpage in a browser, you generally don’t need to bother with package_search. Copy the final part of the URL and pass it directly to package_show. Search is most useful when you do not know the package name yet.
If a resource has datastore_active == TRUE, use its id with datastore_search. If datastore_active == FALSE, use the resource url and read the file according to its format, typically one of CSV, XLSX, GeoJSON, or ZIP. If a package has several resources, choose by filtering down to language, format, and name etc… to find the correct resource.
Organizing Dataset
The following code is used to download the dataset. Rather than reading a static CSV snapshot, we use Ontario’s CKAN DataStore API. The resource id discovered above identifies the black bear hunting activity table, and the pagination loop retrieves all available records.
datastore_search_url = f"{api_base}/datastore_search"

def get_all_records(resource_id, limit=1000):
    records = []
    offset = 0

    while True:
        response = requests.get(
            datastore_search_url,
            params={
                "resource_id": resource_id,
                "limit": limit,
                "offset": offset
            },
            timeout=30
        )
        response.raise_for_status()

        page = response.json()["result"]["records"]
        records.extend(page)

        if len(page) < limit:
            break

        offset += limit

    return records

data_download = pd.DataFrame(get_all_records(resource_id))

total = data_download[data_download.WMU == "Total"]
data = data_download[data_download.WMU != "Total"]
datastore_search_url <- paste0(api_base, "/datastore_search")
get_all_records <- function(resource_id, limit = 1000) {
records <- list()
offset <- 0
repeat {
page_url <- paste0(
datastore_search_url,
"?resource_id=", resource_id,
"&limit=", limit,
"&offset=", offset
)
page <- fromJSON(page_url, simplifyDataFrame = TRUE)$result$records
records[[length(records) + 1]] <- page
if (nrow(page) < limit) {
break
}
offset <- offset + limit
}
bind_rows(records)
}
data_download <- get_all_records(resource_id)
total <- data_download |> rename_all(make.names)|> filter(WMU =="Total")
data <- data_download |> rename_all(make.names)|> filter(WMU !="Total")The data has columns wildlife management unit (WMU), year, number of active hunters, and the harvest. The numbers of bear harvested and active hunters are estimated based on the replies received from a sample of hunters. We are interested in both the individual WMUs, and the provided Total = sum (WMU).
# view the first rows
total.head()
_id WMU Year Active Hunters Harvest
1232 1233 Total 2012 21218 5157
1233 1234 Total 2013 20891 4716
1234 1235 Total 2014 22875 5017
1235 1236 Total 2015 26293 6662
1236 1237 Total 2016 31480 8152# viewthe last rows
data.tail() _id WMU Year Active Hunters Harvest
1227 1228 82A 2021 19 4
1228 1229 82A 2022 26 2
1229 1230 82A 2023 20 2
1230 1231 82A 2024 24 2
1231 1232 82A 2025 36 6# view the first rows
head(total) X_id WMU Year Active.Hunters Harvest
1 1233 Total 2012 21218 5157
2 1234 Total 2013 20891 4716
3 1235 Total 2014 22875 5017
4 1236 Total 2015 26293 6662
5 1237 Total 2016 31480 8152
6 1238 Total 2017 28718 6497# view the last rows
tail(data) X_id WMU Year Active.Hunters Harvest
1227 1227 82A 2020 33 4
1228 1228 82A 2021 19 4
1229 1229 82A 2022 26 2
1230 1230 82A 2023 20 2
1231 1231 82A 2024 24 2
1232 1232 82A 2025 36 6Plotting the Number of Bear Hunters and Harvest
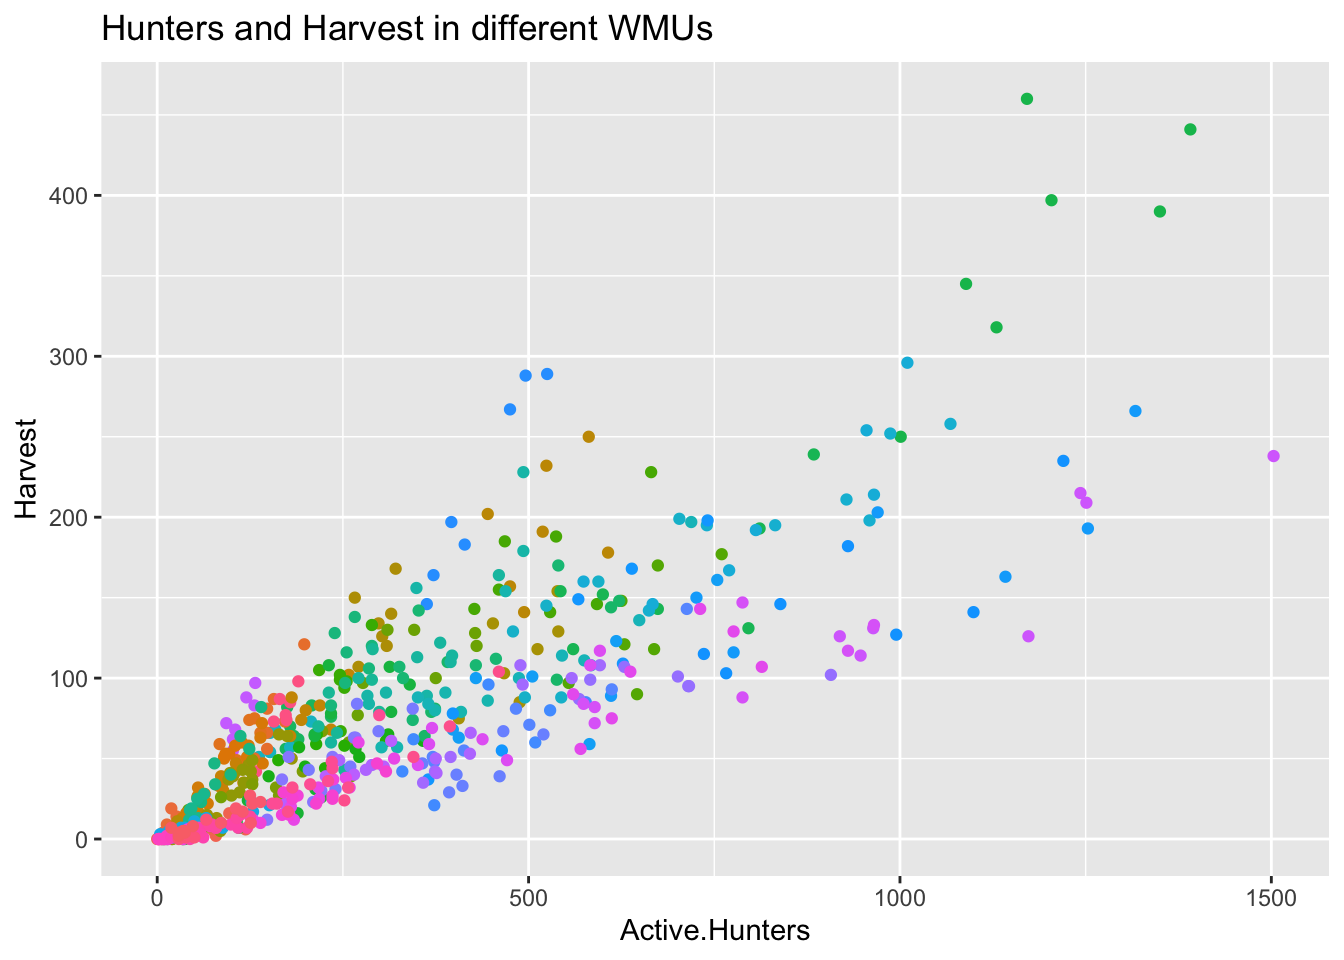
The following code plots the number of bears harvested per active hunter in each WMU.
harvest_hunter_plot = sb.scatterplot(data = data,
                                     x = 'Active Hunters',
                                     y = 'Harvest',
                                     hue = 'WMU',
                                     legend = False)
harvest_hunter_plot.set_title("Hunters and Harvest in different WMUs");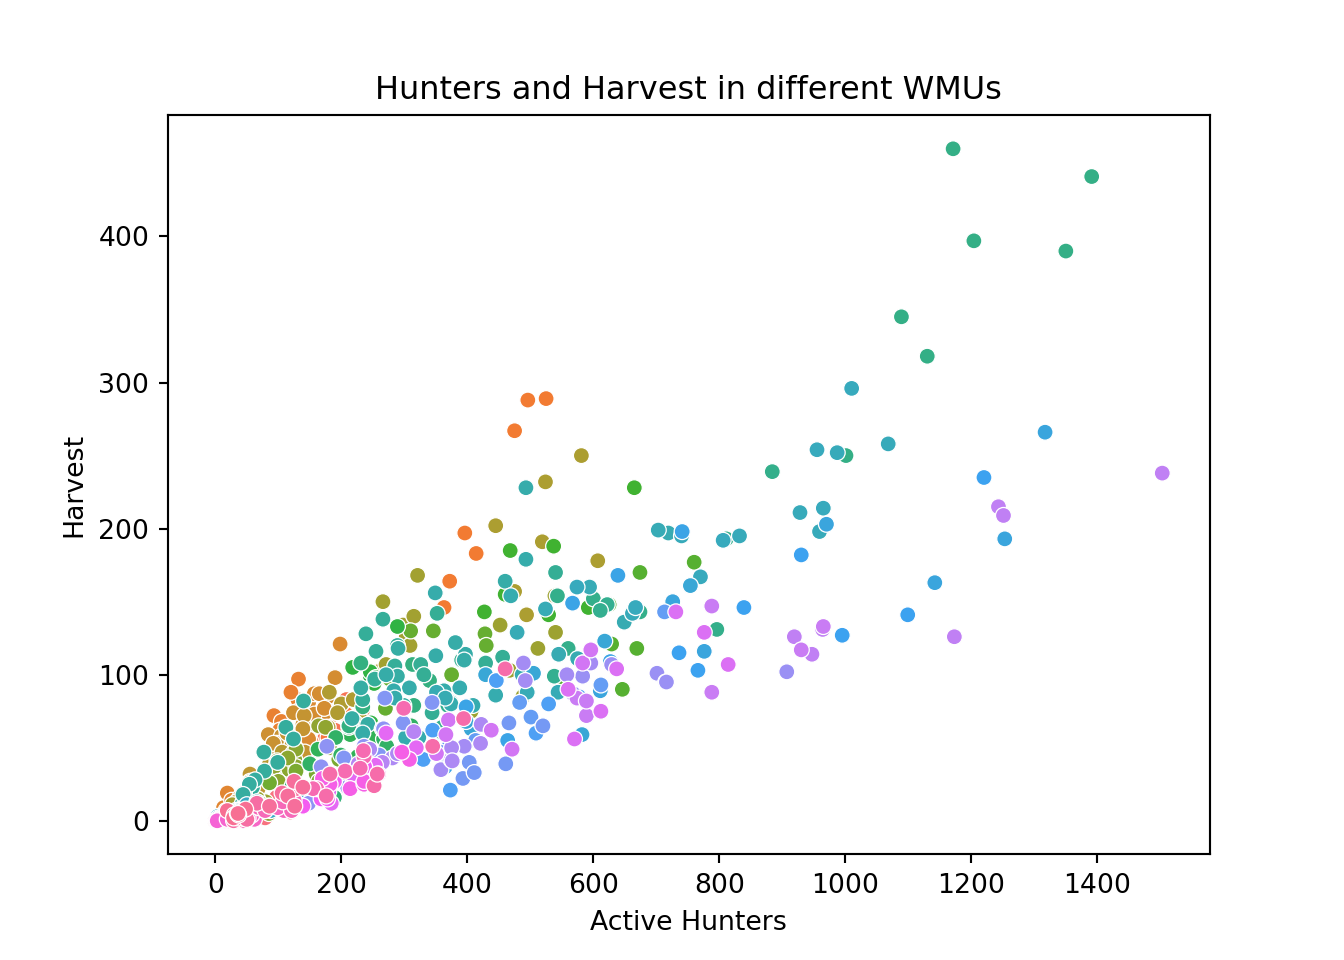
ggplot(data, aes(x = Active.Hunters, y = Harvest, colour = WMU))+
  geom_point(show.legend = FALSE)+
  ggtitle("Hunters and Harvest in different WMUs")