Possible Analysis and Keywords
- Linear Chart
- Simple Linear Regression
- Time Series
- Hunting Bears
- Wildlife Data
- Ontario Open Data
Data Provider
The provincial government of Ontaio provides open access to thousands of data sets via their Open Data Ontario portal. The purpose of sharing all data documents with the public is to remain transparent and accessible. More details about the data license, training materials, and other information can be found here.
Black Bear Hunting Activity
The dataset records numbers of black bears harvested and active black bear license holders every year from 2012 to 2018 in different wildlife management unit (WMU). The WMUs are the administrative coverage area that serves as a land base for wildlife monitoring and management.
The original dataset of bear harvested and active hunters and its supporting document can be found here and you can quickly preview the CSV dataset file here. Moreover, The legend description can be viewed here.
Exploratory Analysis
Organizing Dataset
The following code is used to download and change the data format of the year.
library(latticeExtra)
library(tidyverse)

# Download the csv file AND change the data format of the year
data_download <- read_csv("https://files.ontario.ca/opendata/black_bear_2019.csv")


total <- data_download |> rename_all(make.names)|> filter(WMU =="Total")
data <- data_download |> rename_all(make.names)|> filter(WMU !="Total")
The data has columns WMU, year, number of active hunters, and the harvest. All numbers of bear harvested and active hunters are estimated based on the replies received from a sample of hunters, so it might contain a statistical error. In the WMU called Total, all of the WMUs are summed.
head(total)## # A tibble: 6 × 4
## WMU Year Active.Hunters Harvest
## <chr> <dbl> <dbl> <dbl>
## 1 Total 2012 21218 5157
## 2 Total 2013 20891 4716
## 3 Total 2014 22875 5017
## 4 Total 2015 26293 6662
## 5 Total 2016 31480 8152
## 6 Total 2017 28718 6497head(data)## # A tibble: 6 × 4
## WMU Year Active.Hunters Harvest
## <chr> <dbl> <dbl> <dbl>
## 1 01A 2012 1 0
## 2 01A 2013 6 0
## 3 01A 2014 6 2
## 4 01A 2015 8 2
## 5 01A 2016 0 0
## 6 01A 2017 6 0Plotting the Number of Bear Hunters and Harvest
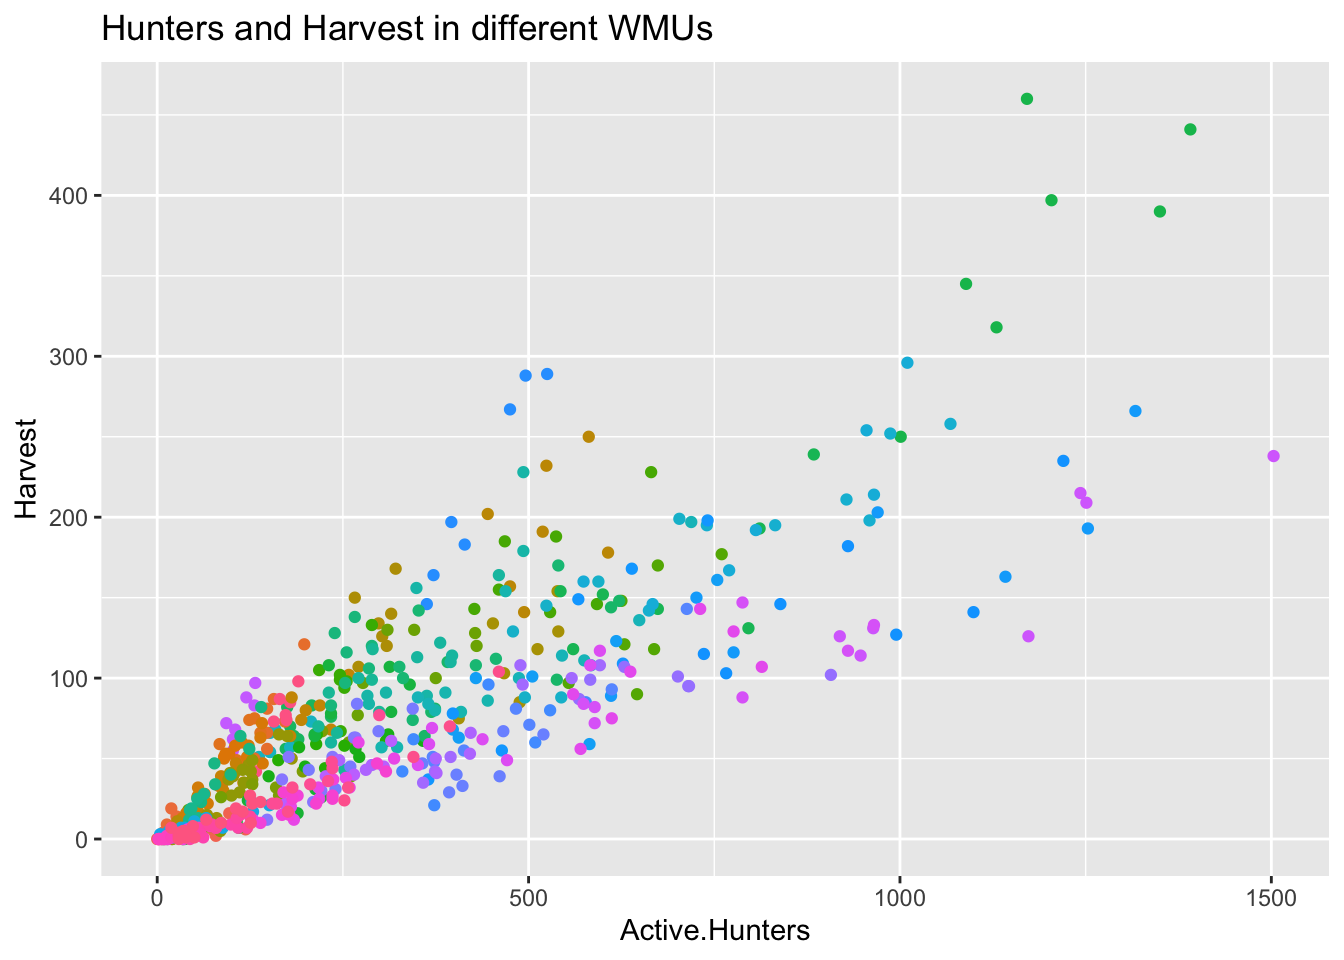
The following code plots the number of bears harvested per active hunter in each WMU.
ggplot(data, aes(x = Active.Hunters, y = Harvest, colour = WMU))+
  geom_point(show.legend = FALSE)+
  ggtitle("Hunters and Harvest in different WMUs")