Possible analysis and Keywords
- Spatial Data Set
- Time Series
- Line Chart
- Simple Linear Regression
- Greenhouse Flowers and Plants
- Production Data
Data Provider
Statistics Canada’s Open Government is a free and open-access platform containing over 80,000 datasets across diverse subjects. The purpose of sharing all data documents with the public is to remain transparent and accessible.
Dataset can be discovered by multiple searching methods here, such as Browse by subject, Open Government Portal for direct keywords search, Open Maps which contains geospatial information data, Open Data Inventory from the government of Canada organization, Apps Gallery for representing those mobile and web-based application data, Open Data 101 for letting people know how to use dataset and so on.
Production and Sales of Greenhouse flowers and plants
The annual production and sales of different types of flowers and plants from 2007 to 2019 in Canada is compiled with its metadata file here. The metadata contains detailed variable descriptions. The dataset and supporting documentation can are available from Statistics Canada.
Variables include years from 2007 to 2019, province of production, flower and plant types, and production count and sales.
Exploratory Analysis
Organizing Dataset
The following R code is used to obtain and organize the dataset and separate it into two by output type (sales and production).
library(tidyverse)
library(GGally)
# Download the zip file of plant sales and production
temp <- tempfile()
download.file("https://www150.statcan.gc.ca/n1/tbl/csv/32100246-eng.zip",temp)
(file_list <- as.character(unzip(temp, list = TRUE)$Name))
## [1] "32100246.csv" "32100246_MetaData.csv"plants <- read_csv(unz(temp, file_list[1]))
unlink(temp) # Delete temp file
# Rename a couple of columns
plants <- plants |>
rename(year = REF_DATE, location = GEO) |> # personal preference for these names
rename_all(make.names)# R friendly naming that replaces spaces with '.'Greenhouse plants production and sales in Canada
The following code is used to plot greenhouse plant production and sales in Canada.
# Subset a dataset of plants production in Canada
plants |> subset(location == "Canada" & Output =="Production (number)") |>
ggplot( aes(x = year, y = VALUE, group = Flowers.and.plants)) +
  labs(y = "Production (number)", title = "Greenhouse plants production in Canada") +
  geom_line(aes(color = Flowers.and.plants))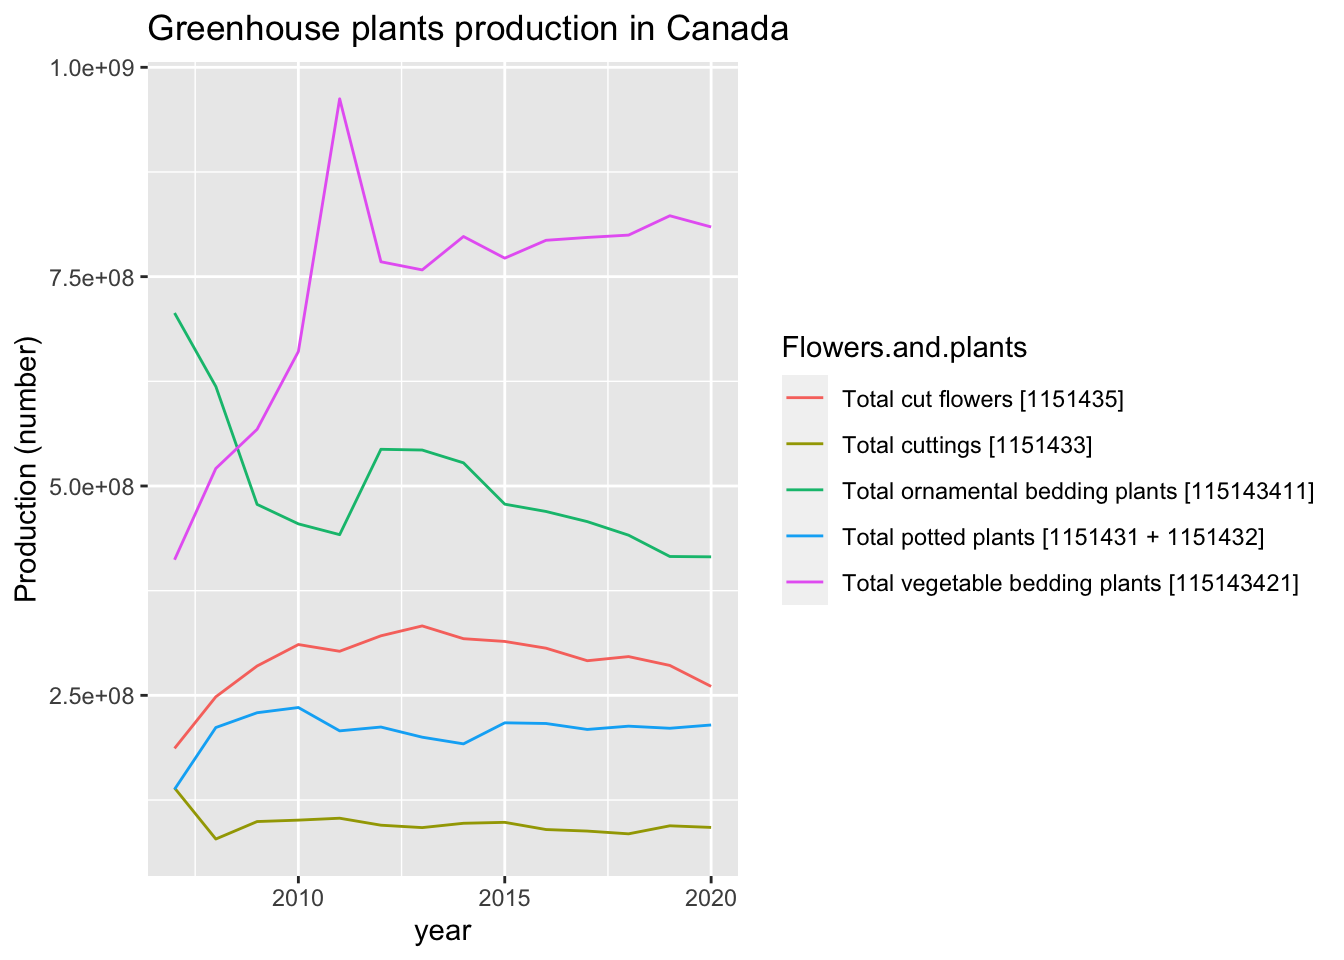
plants |> subset(location == "Canada" & Output =="Sales") |>
ggplot( aes(x = year, y = VALUE, group = Flowers.and.plants)) +
  labs(y = "Sales ($ dollars)", title = "Greenhouse plants sales in Canada") +
  geom_line(aes(color = Flowers.and.plants))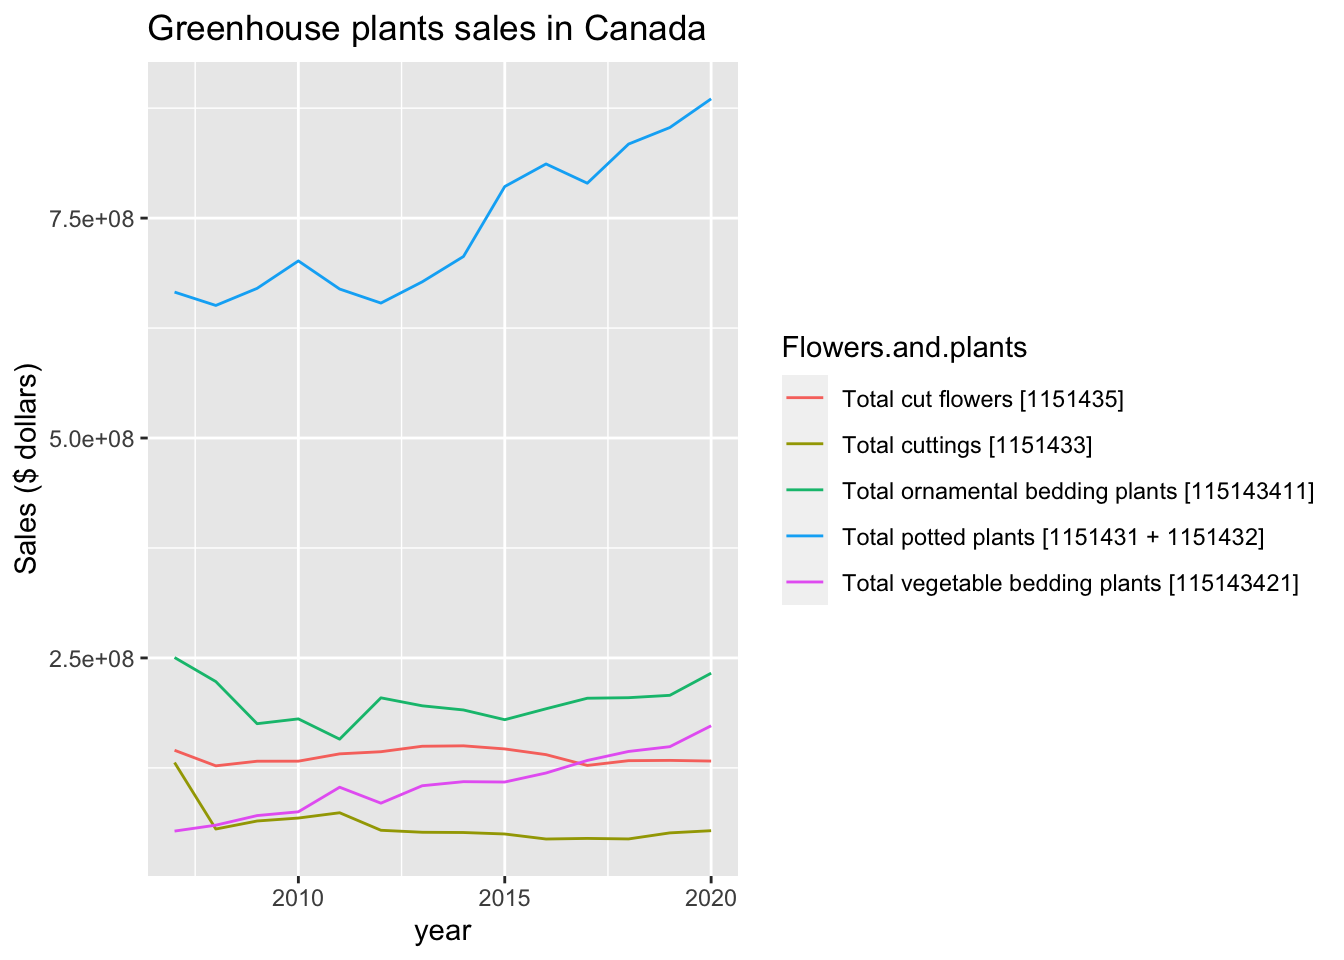
- So, the following code is used to discover the plant production in different provinces.
Bedding plants (vegetables & ornamental) production
# Select the datasets of two different bedding plants (vegetable & ornamental) in 10 different provinces

plants |> subset(location != "Canada" & Output =="Production (number)" & Flowers.and.plants =="Total vegetable bedding plants [115143421]") |>
ggplot( aes(x = year, y = VALUE, group = location)) +
  geom_line(aes(color = location)) +
  labs(y = "Number produced")+
  ggtitle("Total vegetable bedding plants production")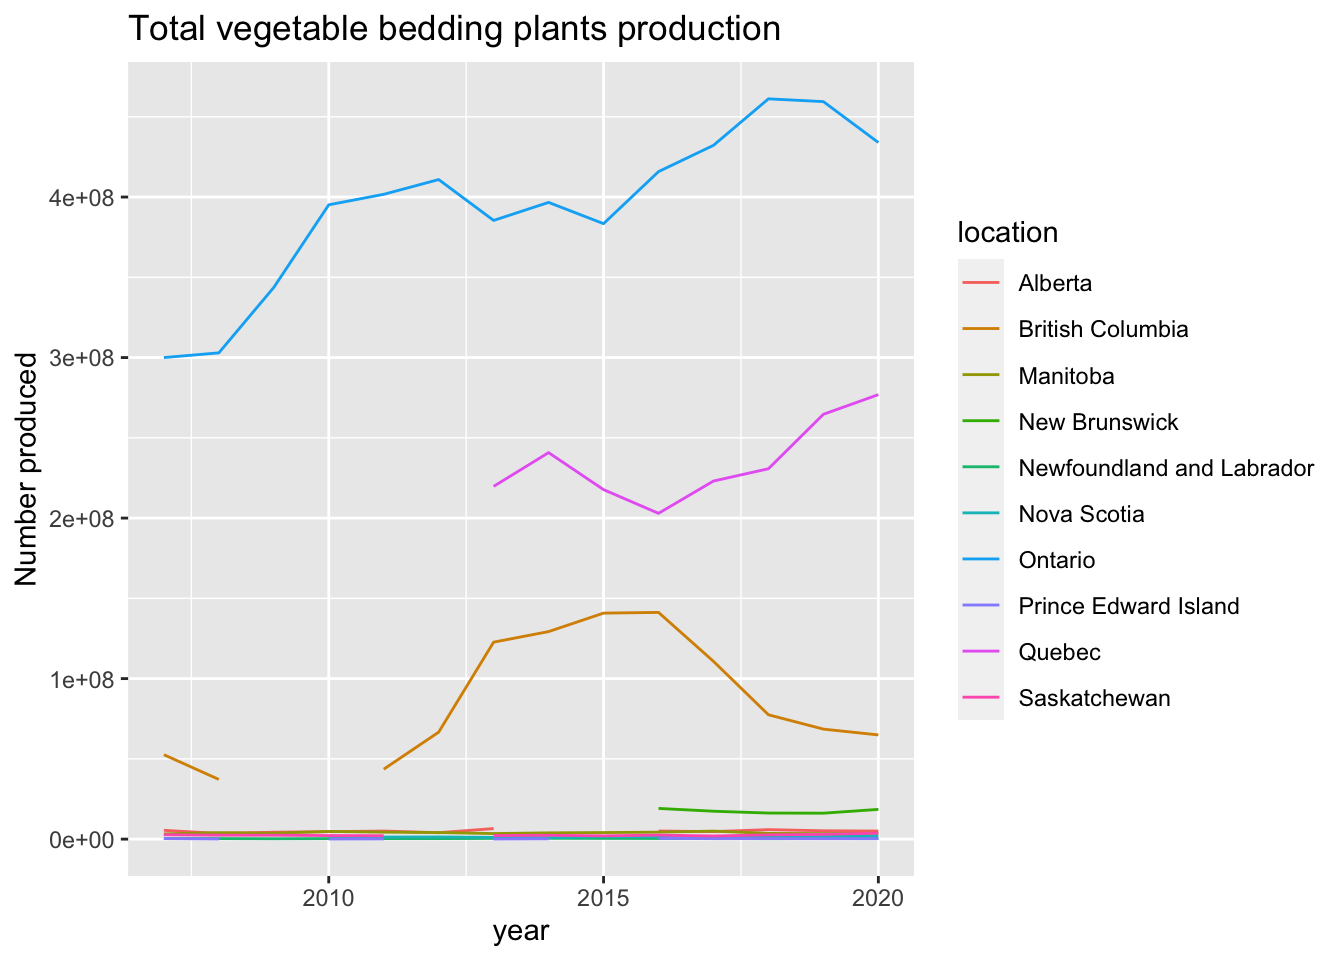
plants |> subset(location != "Canada" & Output =="Production (number)" & Flowers.and.plants =="Total ornamental bedding plants [115143411]") |>
ggplot( aes(x = year, y = VALUE, group = location)) +
  geom_line(aes(color = location)) +
  labs(y = "Number produced")+
  ggtitle("Total ornamental bedding plants production")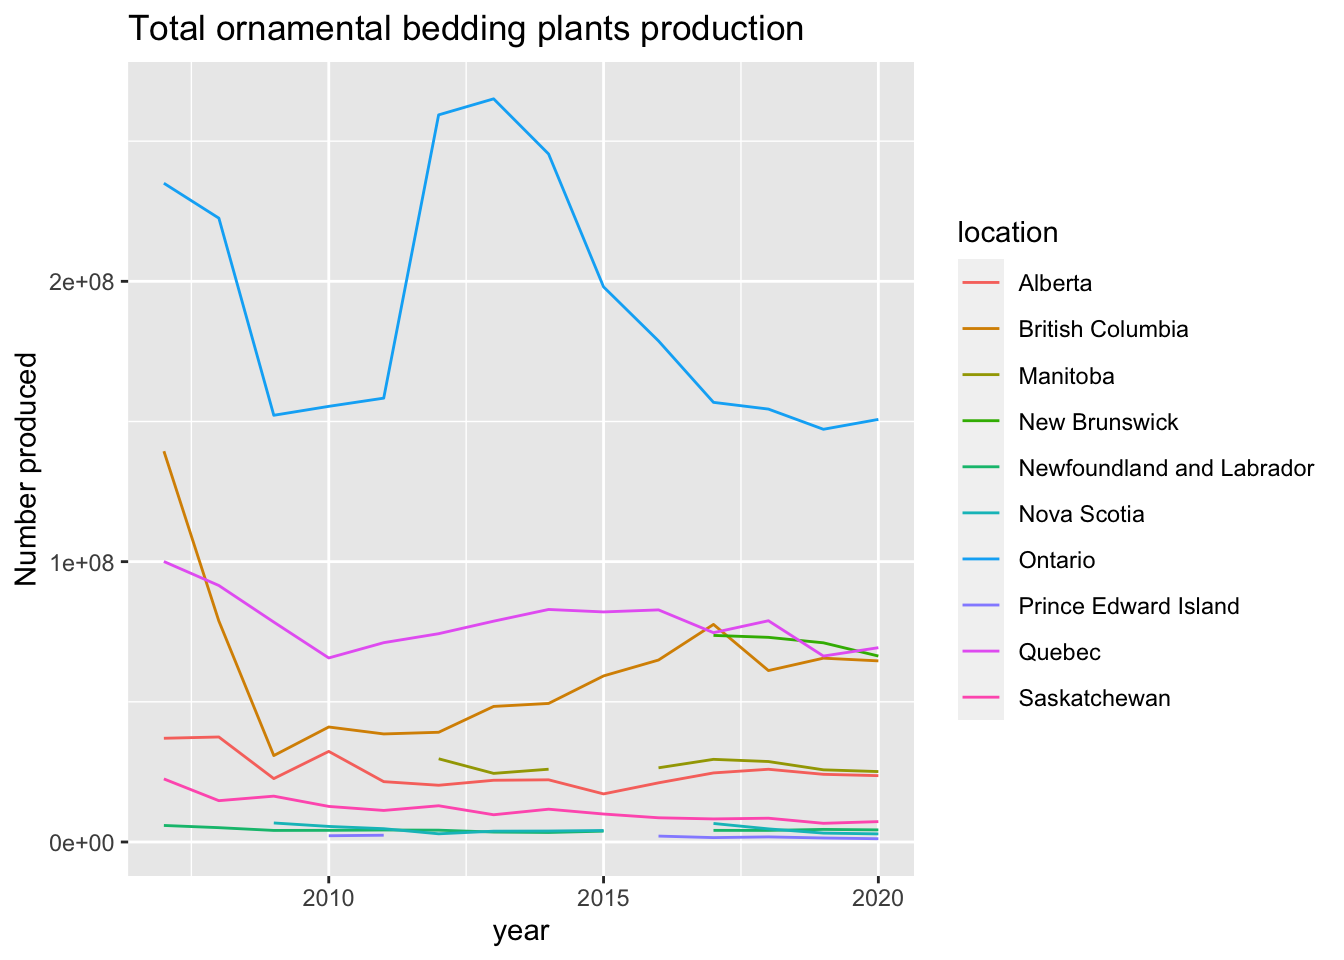
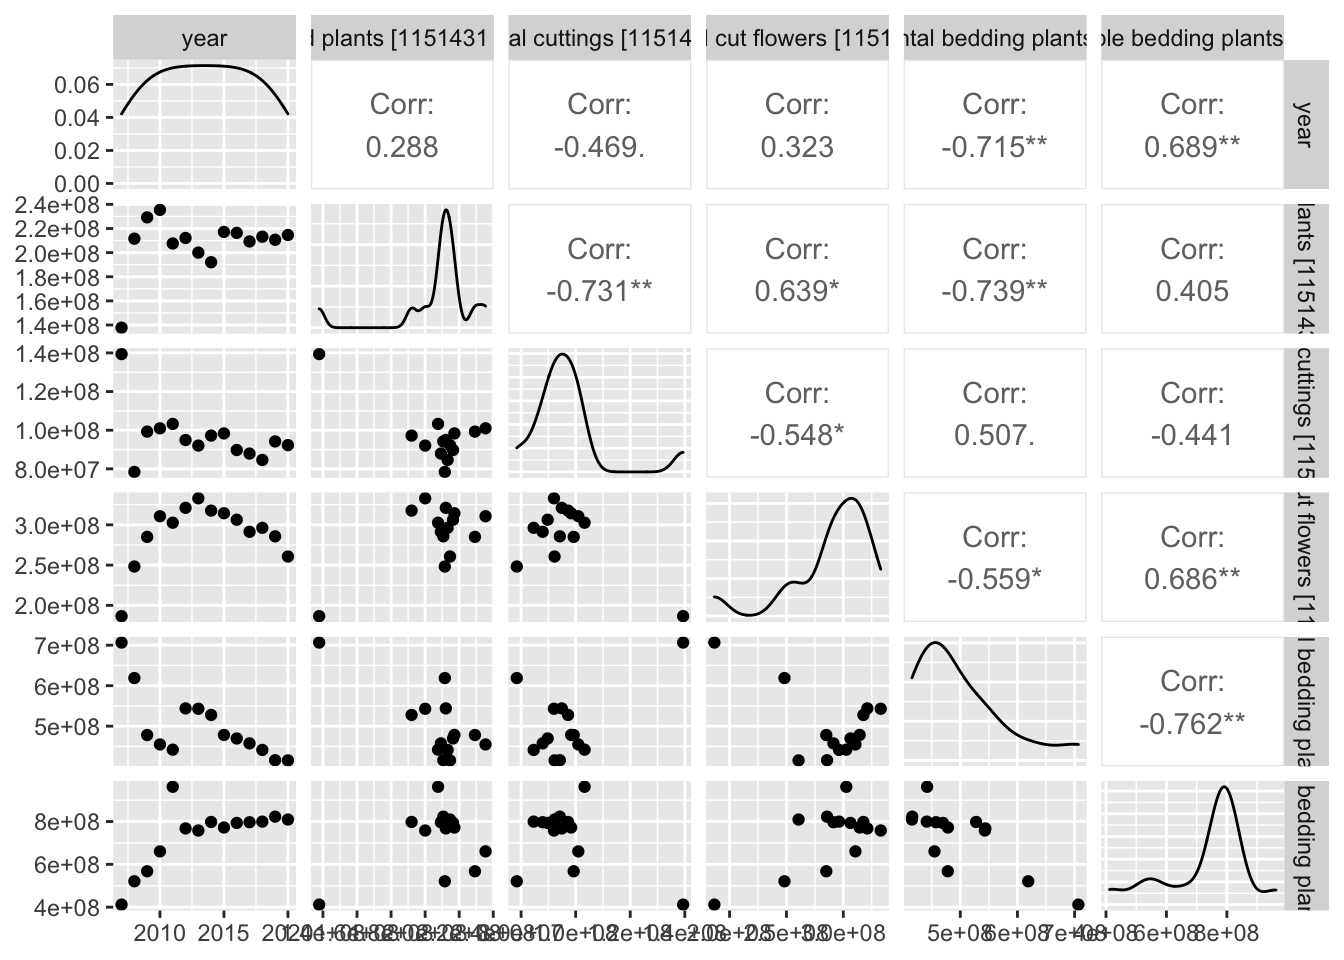
Examining all production counts within Canada
plants |> subset(location == "Canada" & Output =="Production (number)") |>
  select(year, Flowers.and.plants, VALUE)|>
  pivot_wider(names_from= Flowers.and.plants,values_from=VALUE) |>
  ggpairs()