Possible analysis and Keywords
- Time Series
- Spatial Data Set
- Linear Chart
- Mother Tongue
- Population Data
Data Provider
Statistics Canada’s Open Government is a free and open-access platform containing over 80,000 datasets across diverse subjects. The purpose of sharing all data documents with the public is to remain transparent and accessible.
Dataset can be discovered by multiple searching methods here, such as Browse by subject, Open Government Portal for direct keywords search, Open Maps which contains geospatial information data, Open Data Inventory from the government of Canada organization, Apps Gallery for representing those mobile and web-based application data, Open Data 101 for letting people know how to use dataset and so on.
Population by mother tongue and geography from 1951 to 2016
This census dataset tabulates the population and percentage by three different types of mother tongue (English, French, and non-official languages) from 1951 to 2016.
The dataset and its metadata file which contains detailed variable descriptions have been stored together as a zip file here. Alternatively, customized tables are available here.
Exploratory Analysis
Data Acquisition
The following code is used to download and organize the original dataset, and eparate it into two by groups of population and percentage.
# library
library(ggplot2)
library(tidyverse)
library(gridExtra) #for grid.arrage() function

# Download the zip file of population by mother tongue
temp <- tempfile()
download.file("https://www150.statcan.gc.ca/n1/tbl/csv/15100003-eng.zip",temp)
(file_list <- as.character(unzip(temp, list = TRUE)$Name))
## [1] "15100003.csv" "15100003_MetaData.csv"tongue <- read_csv(unz(temp, "15100003.csv"))
unlink(temp) # Delete temp file
# Organize the dataset and split it by measurement methods
tongue = tongue |> rename_all(make.names) |>
rename(year = REF_DATE, location = GEO)|>
select(year, location, Mother.tongue, Statistics, VALUE) |>
pivot_wider(names_from= Statistics, values_from=VALUE)Percentage changes of different mother-tongue speakers in Canada
The following code plots count, percentage, and percent change in mother tongue speakers in Canada.
tongue |> subset(location == "Canada" & Mother.tongue != "Total, mother tongue") |>
ggplot( aes(x = year, y = Number, group = Mother.tongue)) +
  labs(title = "Number of speakers of mother tongues in Canada") +
  geom_line(aes(color = Mother.tongue))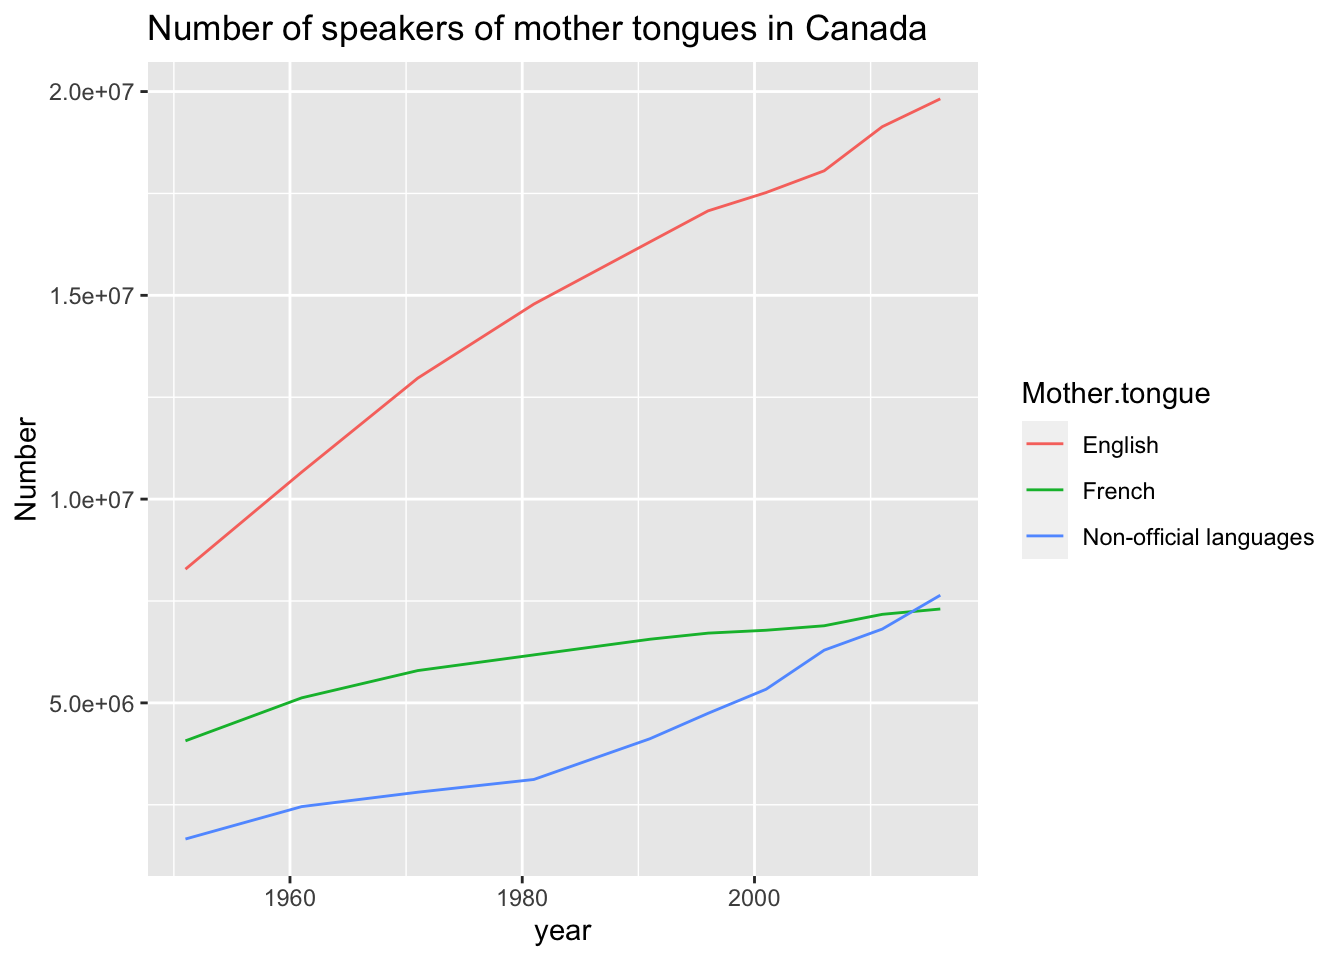
tongue |> subset(location == "Canada" & Mother.tongue != "Total, mother tongue") |>
ggplot( aes(x = year, y = Percentage, group = Mother.tongue)) +
  labs(title = "Percentage of speakers of mother tongues in Canada") +
  geom_line(aes(color = Mother.tongue))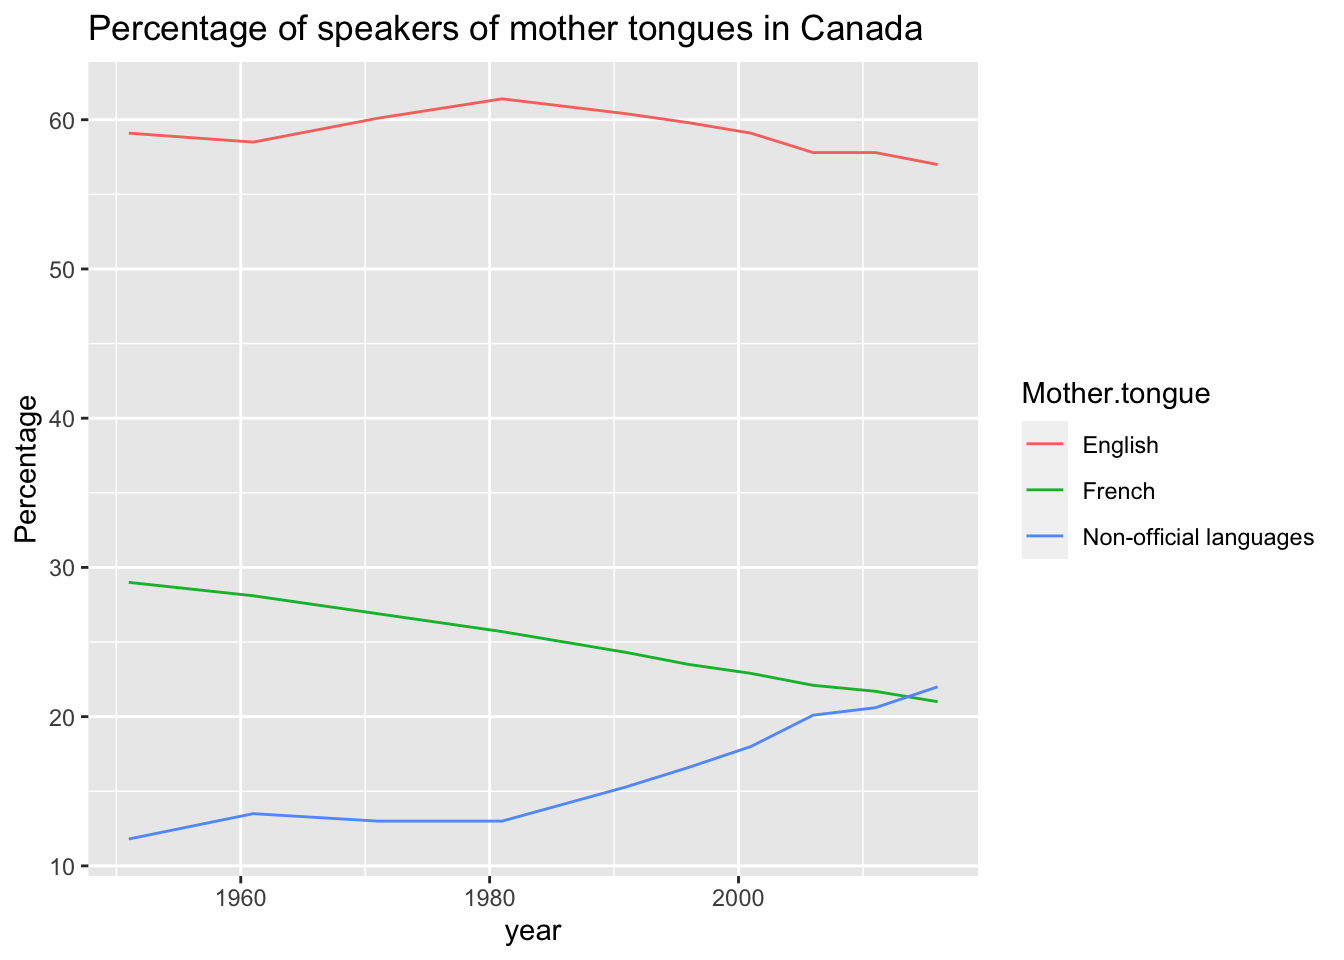
tongue |> subset(location == "Canada" & Mother.tongue != "Total, mother tongue") |>
  group_by(Mother.tongue) |>
  mutate(pct_change = (Percentage/lag(Percentage) - 1) * 100) |>
  na.omit() |>
ggplot( aes(x = year, y = pct_change, group = Mother.tongue)) +
  labs(y = "Percentage Change", title = "Percentage change over 4 years for different mother tongues in Canada") +
  geom_line(aes(color = Mother.tongue))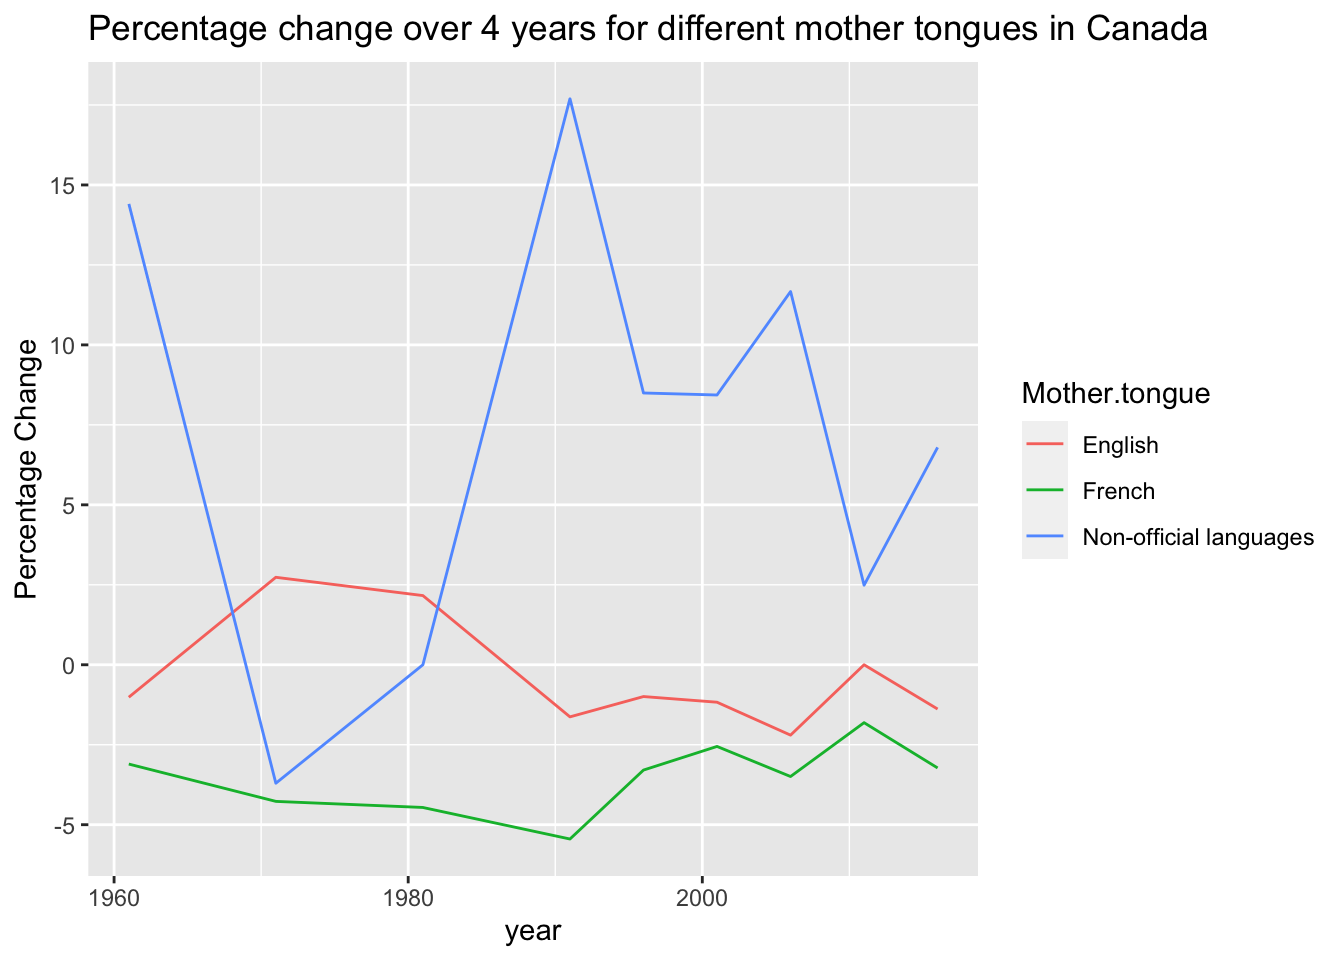
Summary
The upper-panel graph shows the population of different language speakers in Canada from 1961 to 2016. We can see the time series of all different mother-tongue speakers are increasing.
The second-panel graph of [Percentage of different mother tongue speaker in Canada] tells us the proportion of French speakers has decreased steadily, while the proportion of non-official language speakers has grown.
Percentage changes of mother-tongue speakers in different provinces
After comparing changes in mother tongue, the following code focuses on the changes within provinces.
# Plot the French and non-official language speakers proportion among all provinces in Canada
tongue |> subset(location != "Canada" & Mother.tongue == "French")|>
ggplot(aes(x = year, y = Percentage, group = location)) +
  labs(y = "Percentage", title = "Percentage of French  mother tongues in different provinces") +
  geom_line(aes(color = location))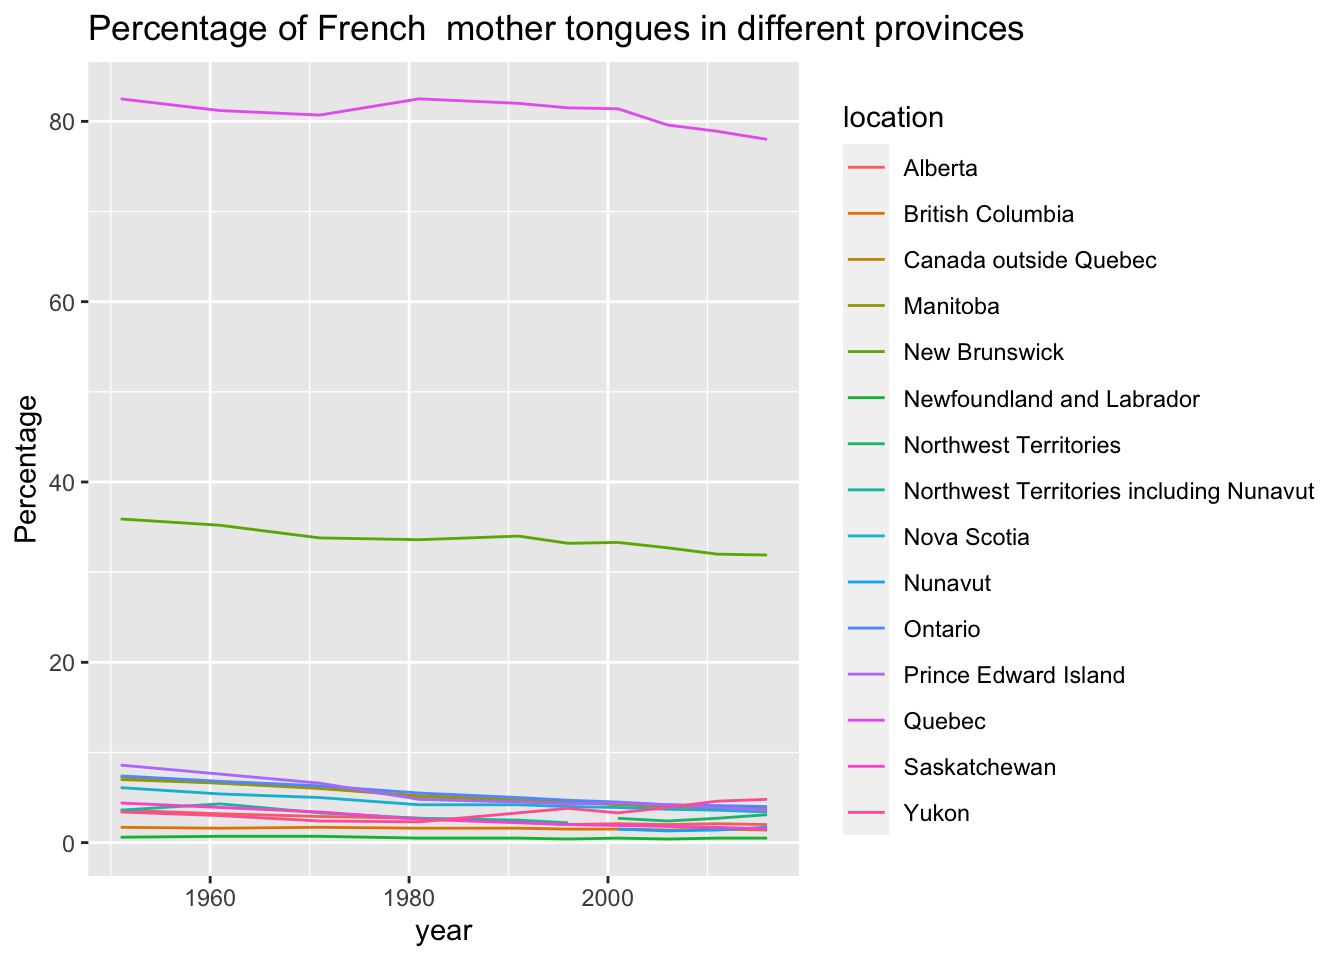
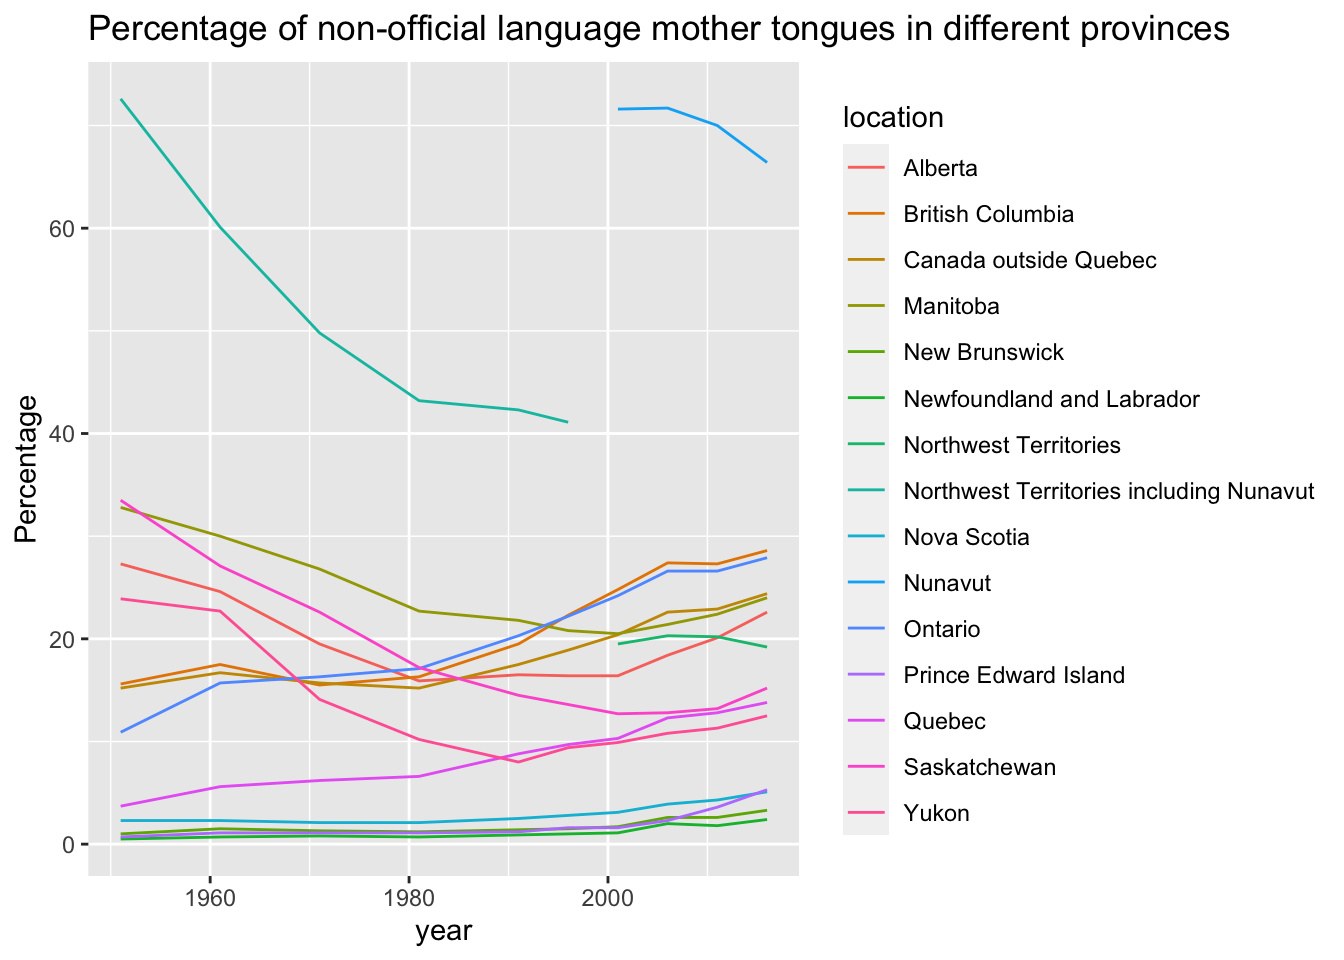
tongue |> subset(location != "Canada" & Mother.tongue == "Non-official languages")|>
ggplot( aes(x = year, y = Percentage, group = location)) +
  labs(y = "Percentage", title = "Percentage of non-official language mother tongues in different provinces") +
  geom_line(aes(color = location))