Possible Analysis and Keywords
- Time Series
- Data Wrangling
- Linear Chart
- Grains Export
- Trade Data
Data Provider
Statistics Canada’s Open Government is a free and open-access platform containing over 80,000 datasets across diverse subjects. The purpose of sharing all data documents with the public is to remain transparent and accessible.
Dataset can be discovered by multiple searching methods here, such as Browse by subject, Open Government Portal for direct keywords search, Open Maps which contains geospatial information data, Open Data Inventory from the government of Canada organization, Apps Gallery for representing those mobile and web-based application data, Open Data 101 for letting people know how to use dataset and so on.
Exports of Grains, by the final destination
This dataset recorded 862 observations from the year 1922 to 2017, the data is described by many dimensions, such as commodities about 9 different types of grains, export destinations of 217 countries, 10 continents(Total Western Europe, Total Asia,…) and 1 total destination (Toal exports, all destinations), the export value unit is recorded as tonnes.
The dataset and its metadata file with detailed variable descriptions have been stored together as a zip file. You can find detailed information here, and you also can quickly discover the customized table here.
Organizing Dataset
The following code is used to extract the whole dataset of grains export from the official website and perform the linear chart of total grains export to all destinations by grouping commodities.
library(tidyverse)

# Download the zip file of the orginial grains export dataset
temp = tempfile()
download.file("https://www150.statcan.gc.ca/n1/tbl/csv/32100008-eng.zip",temp)
(file_list = as.character(unzip(temp, list = TRUE)$Name))
## [1] "32100008.csv" "32100008_MetaData.csv"meta = read_csv(unz(temp, file_list[2]), skip = 8) |> rename_all(make.names) |>
select(Dimension.ID, Member.Name, Member.ID)## Warning: One or more parsing issues, see `problems()` for detailsexport_data = read_csv(unz(temp, "32100008.csv"))
unlink(temp)
# organize the export data
export_data = export_data |>
rename(date = REF_DATE, location = GEO) |>
separate(col = date, into = c("year", "month"), sep = "-")|> # split the year-month column into two different columns
mutate(year = as.numeric(year), month = as.numeric(month)) Some exploratory plots
# Summarize the annual export value by group of the year
 export_data |> group_by(year, Commodity, Destinations) |>
        summarize(total = sum(VALUE)) |>
        subset(Destinations == "Total exports, all destinations") |>
        ungroup() |>
ggplot( aes(x = year, y = total, group = Commodity)) +
  labs(y = "total export (tonnes)") +
  geom_line(aes(color = Commodity)) +
  ggtitle("Total grains export to all destinations")
## `summarise()` has grouped output by 'year', 'Commodity'. You can override using the `.groups` argument.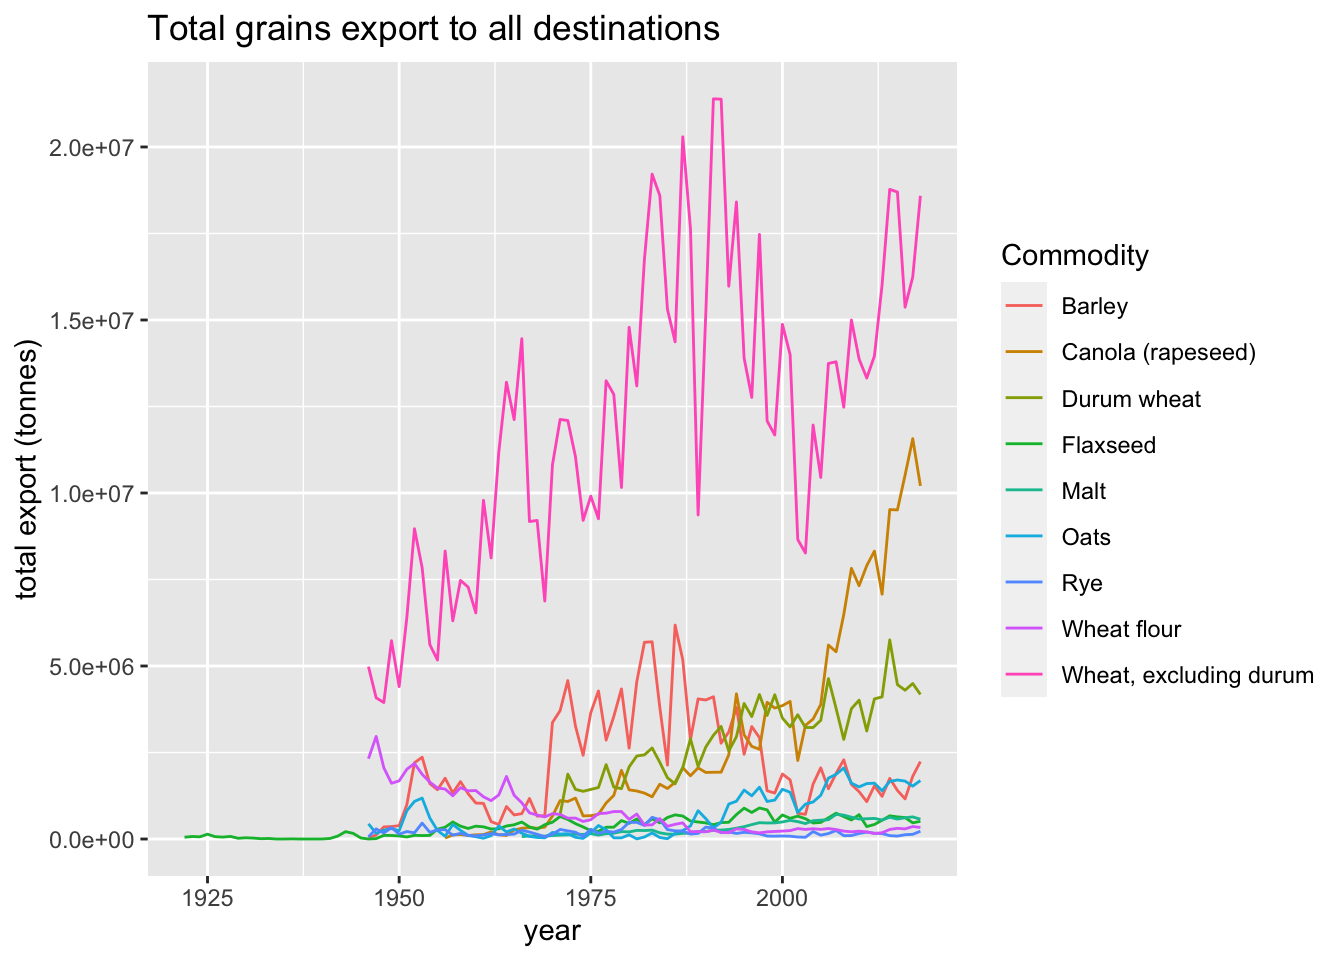
Wheat, excluding durum
The following code is used to plot total exports among different continents and then consider just the major importing countries of canola
# Select the whole export dataset about canola among different continents
export_data |> subset(Commodity == "Wheat, excluding durum" & Destinations != "Total exports, all destinations") |>
           filter( str_detect(Destinations, "Total")) |>
           group_by(year, Commodity, Destinations) |>
           summarize(total = sum(VALUE)) |>
           ungroup() |>
ggplot( aes(x = year, y = total, group = Destinations)) +
  labs(y = "total export (tonnes)") +
  geom_line(aes(colour = Destinations)) +
  ggtitle("Total Annual Wheat, excluding durum, export among different continents")
## `summarise()` has grouped output by 'year', 'Commodity'. You can override using the `.groups` argument.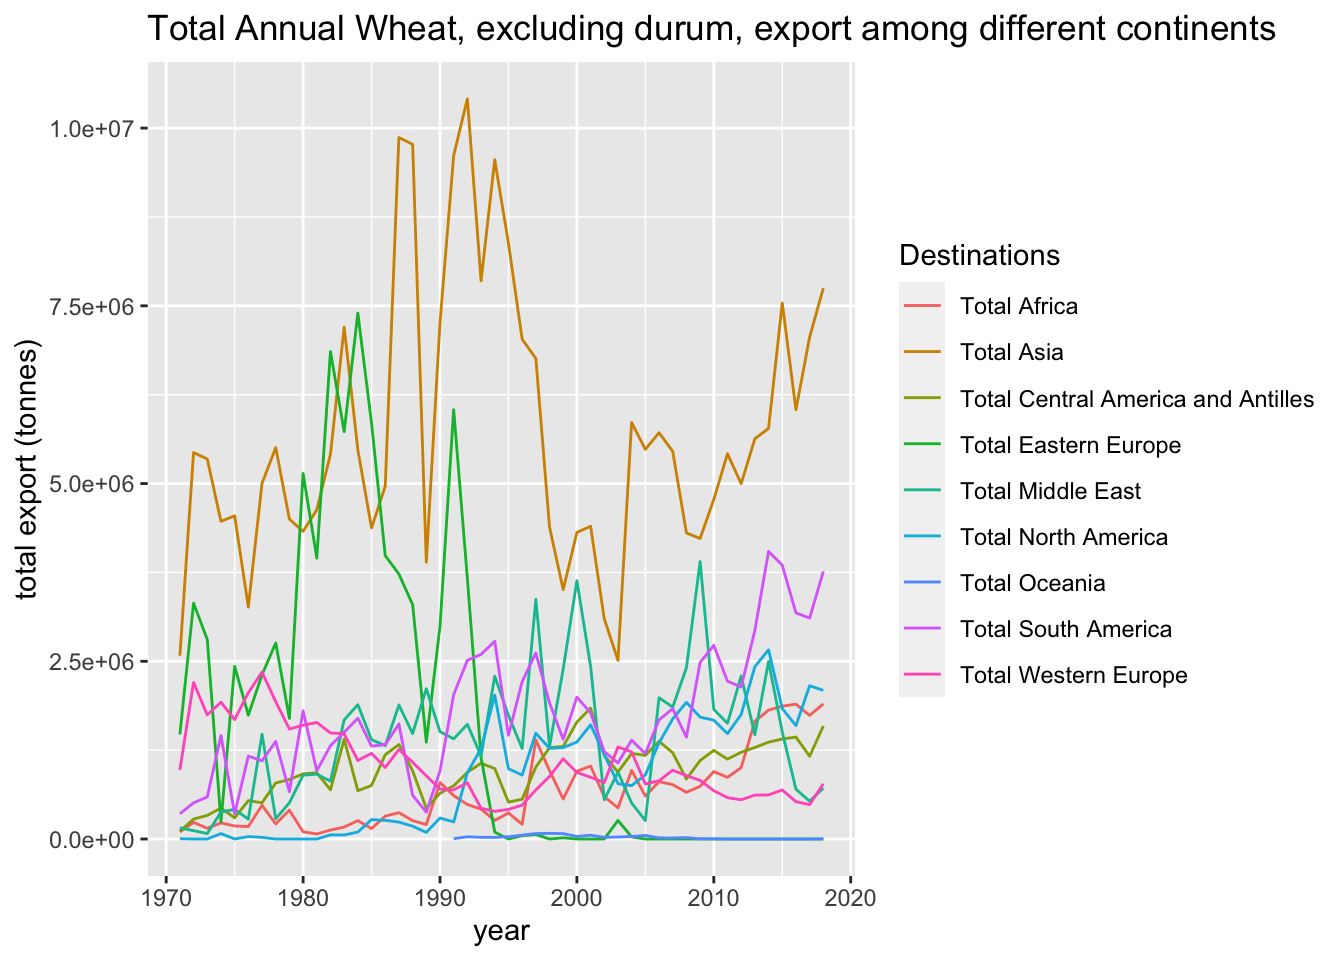
Examining Wheat (excluding durum) for a couple of countries
# Select a few contries and plot their imports

export_data |>
  subset(Commodity == "Wheat, excluding durum" & Destinations %in% c("United States", "People's Republic of China", "United Kingdom", "United Arab Emirates", "India", "Ethiopia")) |>
           group_by(year, Destinations) |>
           summarize(total = sum(VALUE)) |>
           ungroup() |>
ggplot( aes(x = year, y = total, group = Destinations)) +
  labs(y = "total export (tonnes)") +
  geom_line(aes(colour = Destinations)) +
  ggtitle("Total Wheat, excluding durum, exported by year")
## `summarise()` has grouped output by 'year'. You can override using the `.groups` argument.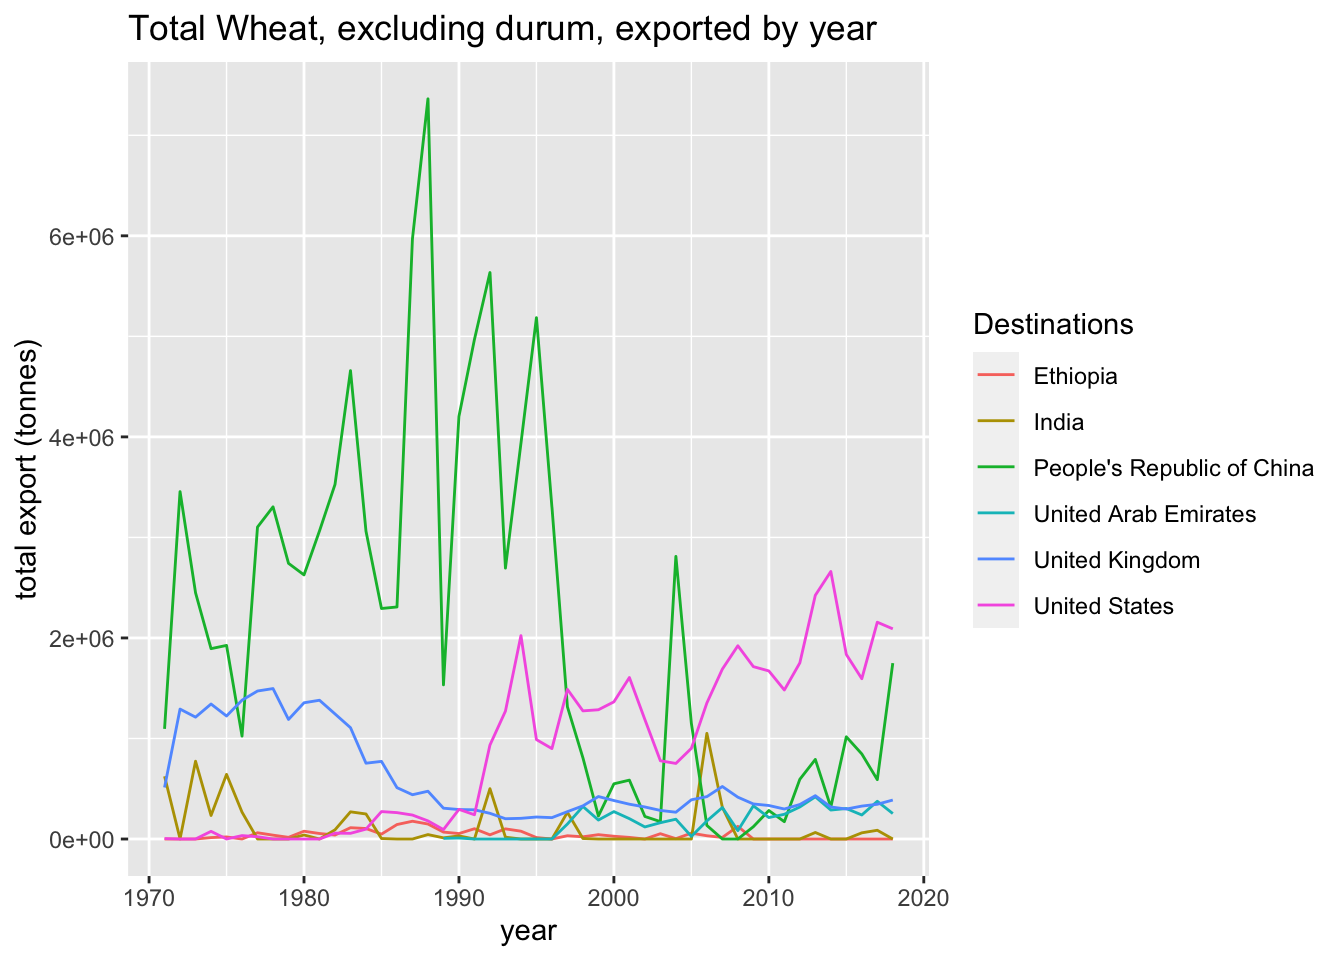
Canola
Now consider canola for countries that have imported at least 1,000,000 tonnes in at least one year. Plot all of their annual import data.
tmp_exports = export_data |>
           subset(Commodity == "Canola (rapeseed)" & Destinations != "Total exports, all destinations") |>
           group_by(year, Commodity, Destinations) |>
           summarize(total = sum(VALUE)) |>
           ungroup() |>
           subset(str_detect(Destinations, "Total") == "FALSE")
## `summarise()` has grouped output by 'year', 'Commodity'. You can override using the `.groups` argument.# find all the countries that surpass 1,000,000 tonnes in at least one year, but keep all of the data for those countries
big_countries = tmp_exports |>
subset(total > 1000000) |>
select(Destinations) |>
unique()
#Subset to just keep the "big" destination countries
tmp_exports |>
subset(Destinations %in% big_countries$Destinations) |>
ggplot( aes(x = year, y = total, group = Destinations)) +
labs(y = "total export (tonnes)") +
geom_line(aes(color = Destinations)) +
ggtitle("Total Canola (rapeseed), for countries that have surpassed 1,000,000 tonnes imported in at least one year")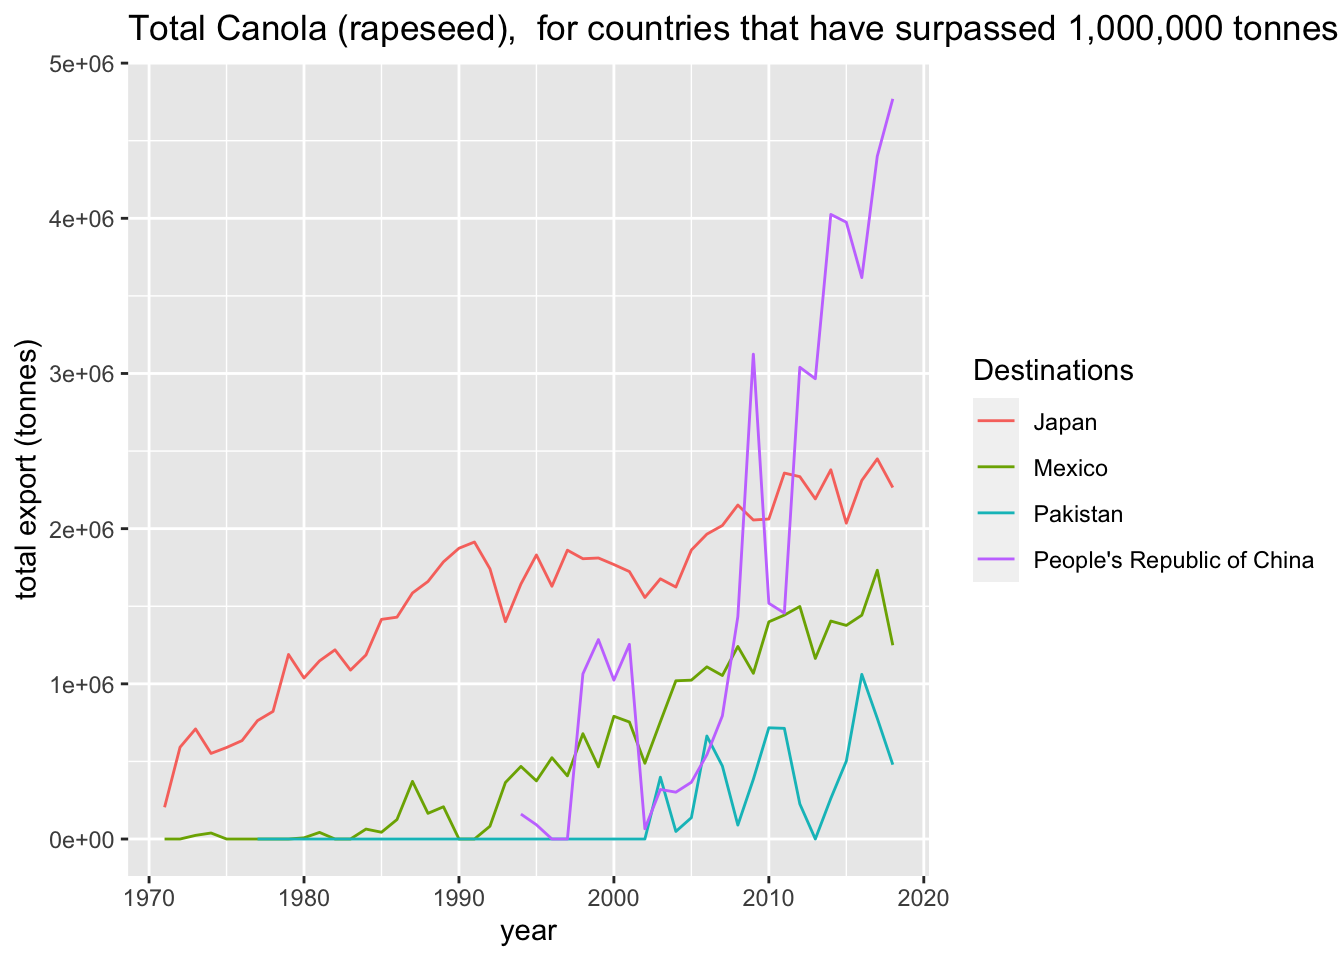
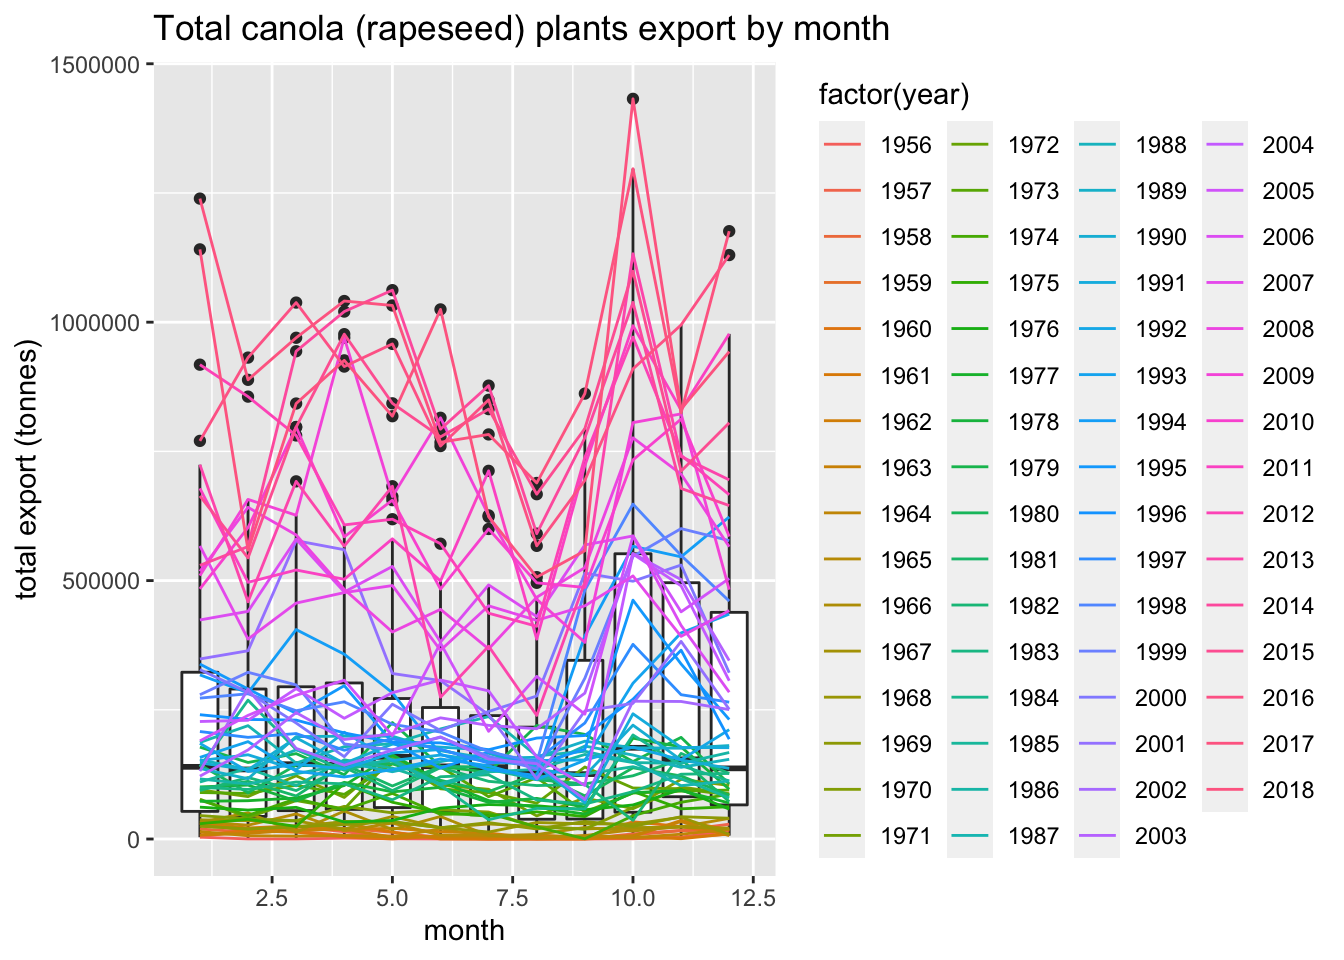
Look at Canola export by month
export_data |>
           subset(Commodity == "Canola (rapeseed)") |>
           filter( str_detect(Destinations, "Total exports, all destinations")) |>
ggplot() +
  geom_boxplot(aes(group = month, y = VALUE, x=month)) +
  geom_line(aes(x = month, group = year, y = VALUE, colour=factor(year)))+
    ggtitle("Total canola (rapeseed) plants export by month")+
  labs(y = "total export (tonnes)")