Possible Analysis and Keywords
- Exploratory Analysis
- Data Wrangling
- Regression
- Spatial Data Set
- Climate Change
- Climate Data
Data Provider
Environment Canada records maintains records of historical weather variables. The available data sets include as monthly summaries, averages, extremes values of temperature, precipitation, degree days, relative humidity, wind speed, and direction among 370 city stations in Canada. The dataset and its description file can be found here.
You also can search for historical climate data by station name and date, province/territory, or do a proximity search.
Climate Data: Daily Weather Report for the first half of 2020
This dataset shows the basic historical weather data in a specific climate station. Both climate ID and TC ID are used to identify meteorological reports, one is assigned by Meteorological Service of Canada, another is assigned by Transport Canada. More glossary can be found here.
The daily climate data in Ottawa is summarized via the Max, Min, and Mean Temperatures, as well as Heat and Cool Degree Days. Data is also collected for the speed and direction of maximum gust when the maximum gust speed exceeds 29 km/h. The data source can be downloaded in CSV form, you can modify the code to download monthly data files, with additional instructions in the “readme.pdf” file here. Each month of daily data becomes its own csv file in the Data sub-folder of the current directory.
#libraries
library(tidyverse)
library(lubridate)
library(RColorBrewer)
#Obtain daily data:
base_url = c("https://climate.weather.gc.ca/climate_data/bulk_data_e.html?format=csv&stationID=4333&Year=", "&Month=1&Day=1&timeframe=2&submit=Download+Data")
#timeframe=2 = daily
#timeframe=3 = monthly
destfile = list()
for(year in 1970:2020){
download.file(paste0(
base_url[1],year,
base_url[2]),
destfile = paste0("Data/Ottawa",year,"-daily.csv"))
}
### Obtain monthly data
#Obtain daily data from 1883 - 2006
base_url = c("https://climate.weather.gc.ca/climate_data/bulk_data_e.html?format=csv&stationID=4333&timeframe=3&submit=Download+Data")
download.file(base_url,
destfile = paste0("Data/Ottawa-monthly.csv"))
#Let's select a city (not Toronto) that has a long history of monthly info that only recently ends
base_url = c("https://climate.weather.gc.ca/climate_data/bulk_data_e.html?format=csv&stationID=5936&timeframe=3&submit=Download+Data")
download.file(base_url,
destfile = paste0("Data/StAmbroise-monthly.csv"))Exploratory Analysis
Loading and compiling the daily data
To load the daily data, loop over all the files in the Data folder.
# Find all csv files in the "Data" folder.
files2load = list.files(path="Data",pattern="daily")
data_daily=NULL
for(lp in 1:length(files2load)){
  data_daily = rbind(data_daily,read_csv(paste0("Data/",files2load[lp])))
}
Make some plots
# convert all column names to valid R syntax:
data_daily = data_daily |> rename_all(make.names)
ggplot(data_daily,aes(x=Date.Time,y=Mean.Temp...C.,colour=factor(Year)))+
  geom_line()+
  ggtitle("Daily Mean Temperatures")+
  theme(legend.position = "none")
## Warning: Removed 130 row(s) containing missing values (geom_path).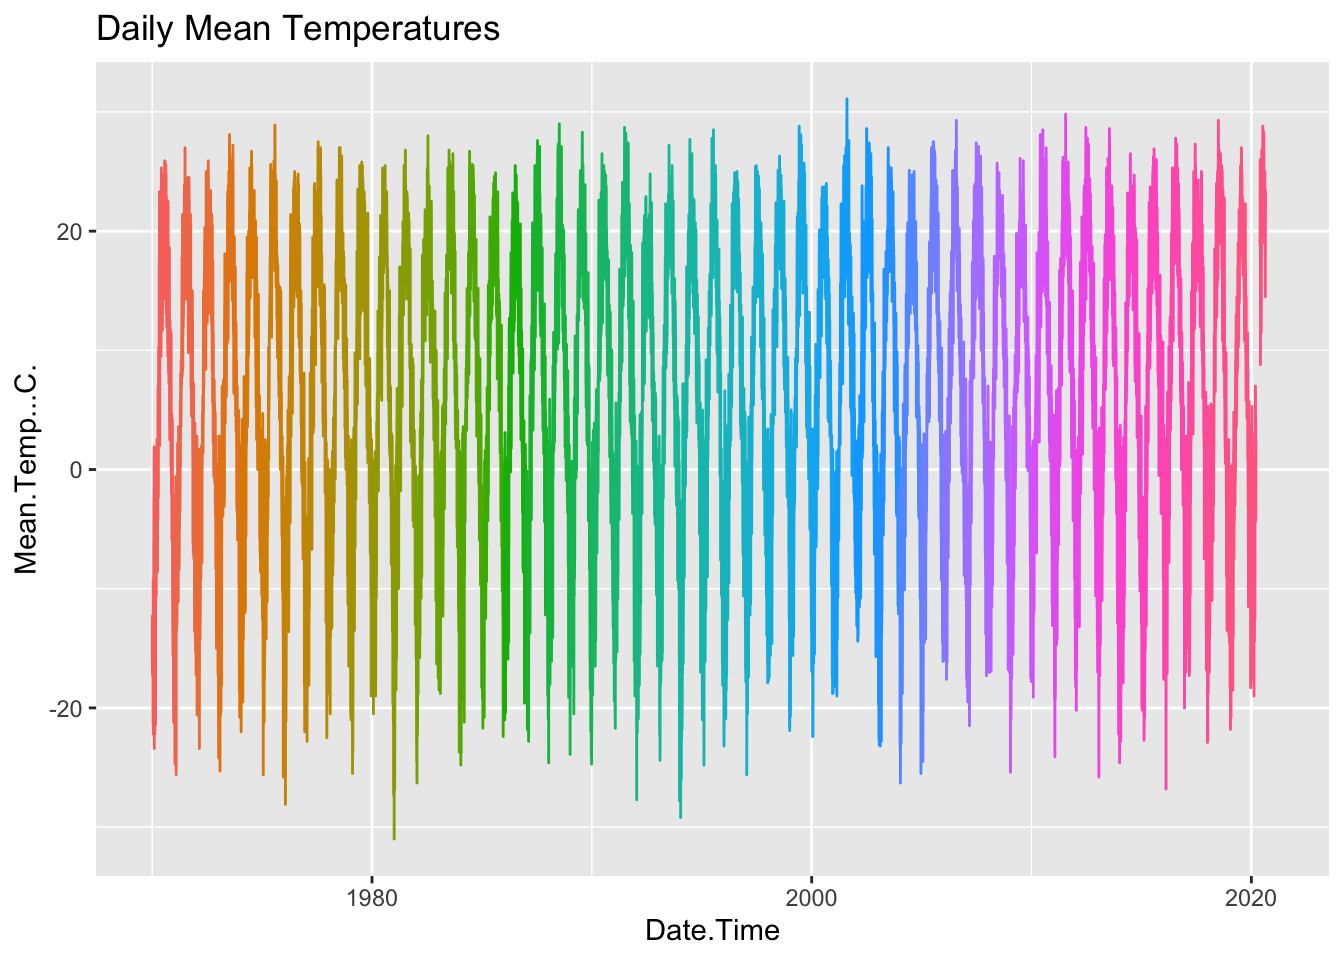
However it is tricky to see a change in a few degrees given the enormous seasonal variation. Let’s focus the plots:
data_daily |>
  filter(Month == "07") |>
  group_by(Year) |>
  summarise(MeanOfJulyMax=mean(Max.Temp...C.),
            MeanOfJanMin=mean(Min.Temp...C.)) |>
  ungroup() |>
ggplot()+
  geom_line(aes(x=Year,y=MeanOfJulyMax , color="red"))+
  geom_line(aes(x=Year,y=MeanOfJanMin,color="blue"))+
  ggtitle("Means of the July Max and Jan Min Temperatures")+
  labs(x = "Year", y="degrees C")+
theme(legend.position = "none") 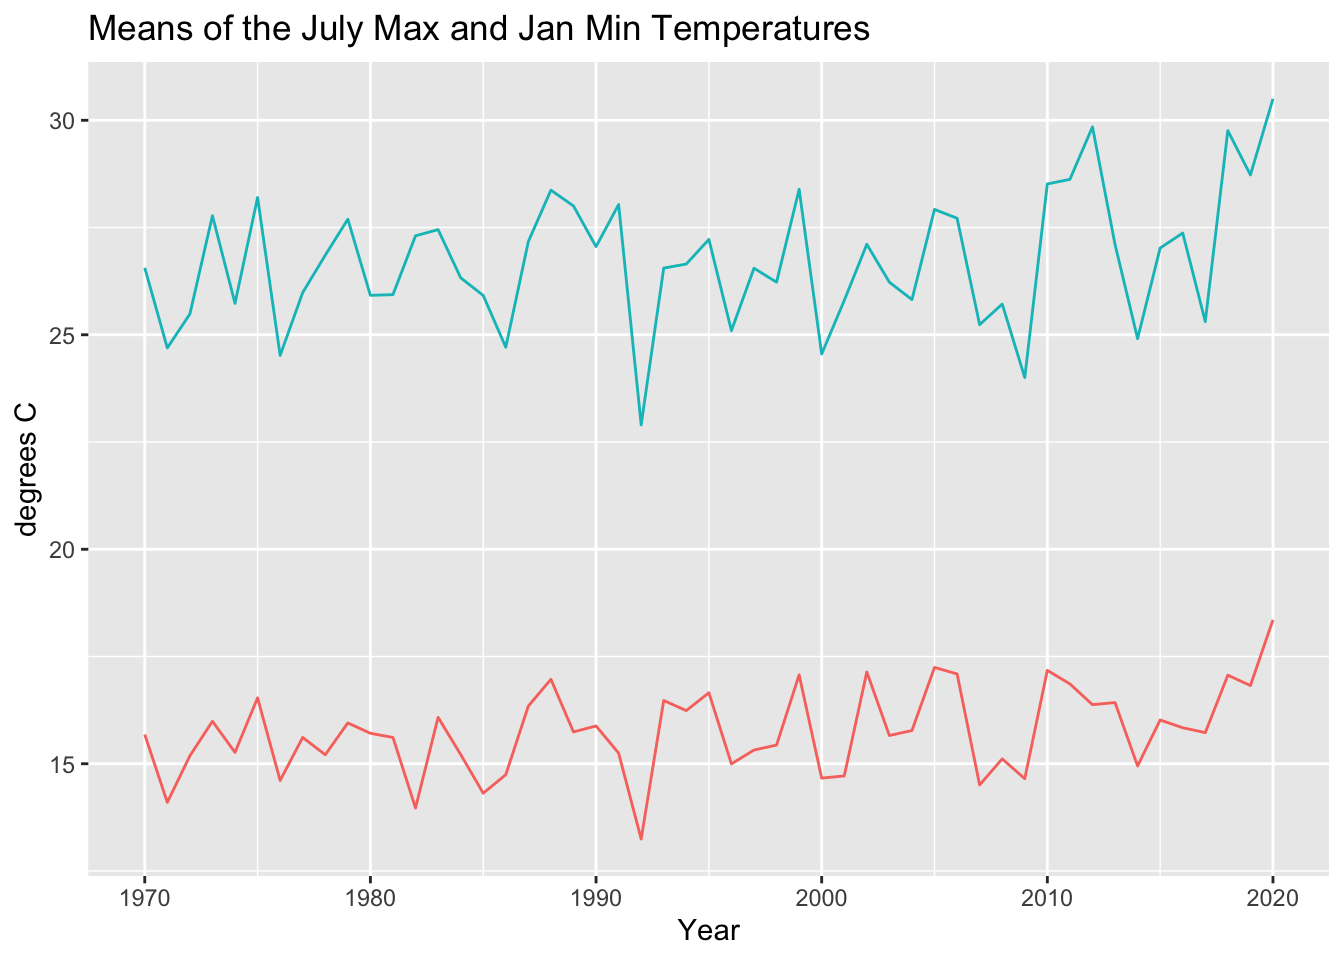
data_daily |>
  filter(Month == "07") |>
  group_by(Year) |>
      summarise(MeanOfJulyMax=mean(Max.Temp...C.),
                MeanOfJanMin=mean(Min.Temp...C.)) |>
  ungroup() |>
ggplot()+
  geom_point(aes(x=MeanOfJulyMax,y=MeanOfJanMin))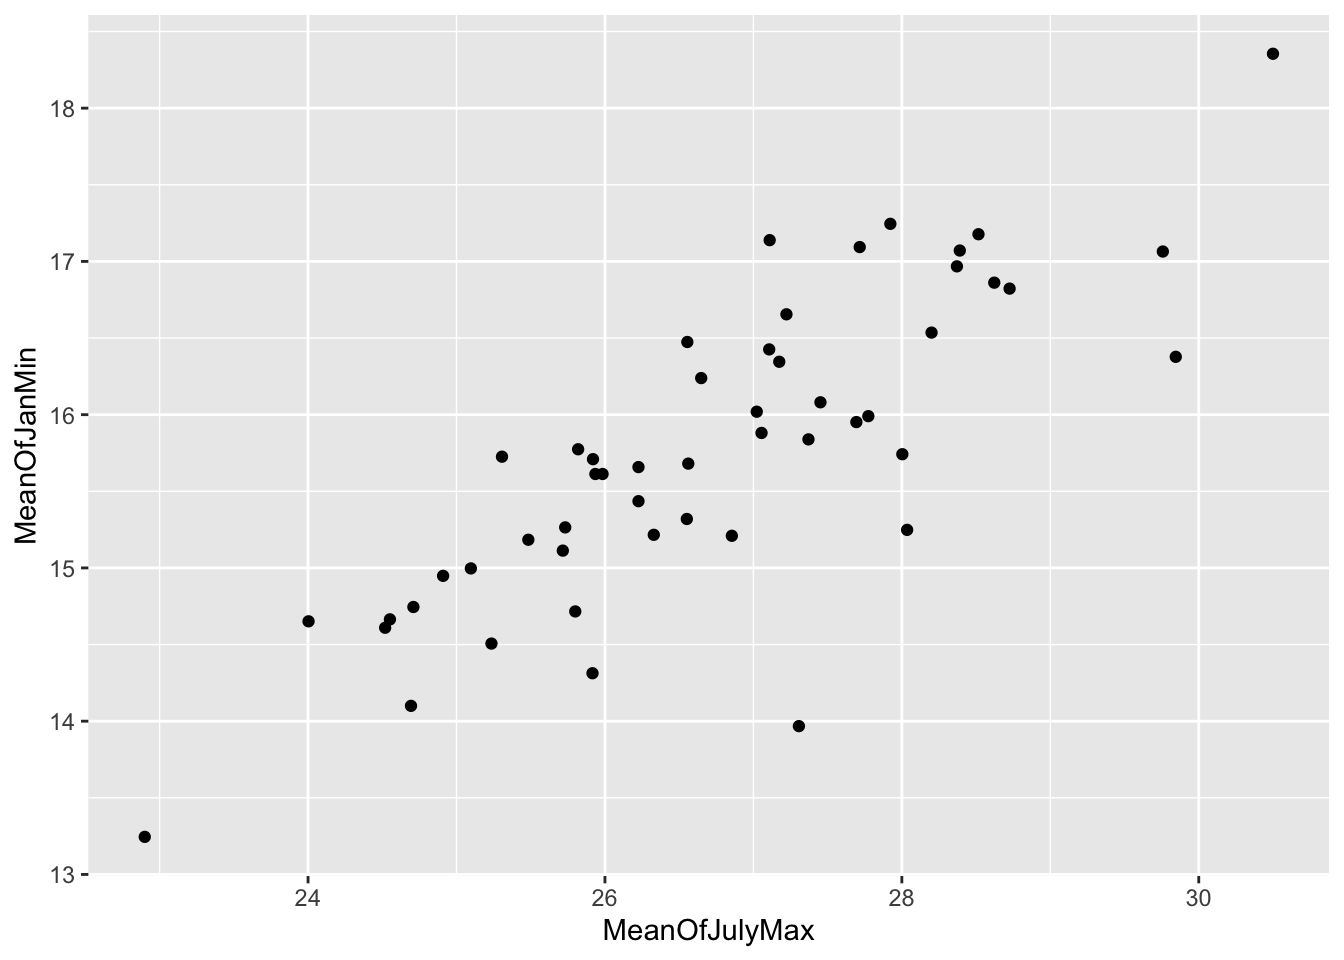
weather = data_dailyLoading and compiling the monthly data
Alternatively we can work with the monthly data, but note that the daily record is ongoing, but started much later than the monthly record. Here we find and load downloaded monthly from the Data folder.
# Find all csv files in the "Data" folder.
file2load = list.files(path="Data",pattern="Ottawa-monthly")
data_monthly = read_csv(paste0("Data/",file2load))
## Rows: 1416 Columns: 29## ── Column specification ────────────────────────────────────────────────────────
## Delimiter: ","
## chr (12): Station Name, Date/Time, Month, Mean Max Temp Flag, Mean Min Temp ...
## dbl (13): Longitude (x), Latitude (y), Climate ID, Year, Mean Max Temp (°C),...
## lgl (4): Dir of Max Gust (10's deg), Dir of Max Gust Flag, Spd of Max Gust ...##
## ℹ Use `spec()` to retrieve the full column specification for this data.
## ℹ Specify the column types or set `show_col_types = FALSE` to quiet this message.# convert all column names to valid R syntax:
data_monthly = data_monthly |> rename_all(make.names)
#convert the dates into valid date format by arbitrarily selecting the 15th of the month to give it a date
data_monthly$Date.Time = as_date(paste0(data_monthly$Date.Time,"-1"))
data_monthly |>
ggplot(
aes(x=Date.Time,y=Mean.Temp...C.,colour=factor(Year)))+
geom_line()+
ggtitle("Monthly Mean Temperatures")+
labs(x = "Year", y="degrees C")+
theme(legend.position = "none") ## Warning: Removed 10 row(s) containing missing values (geom_path).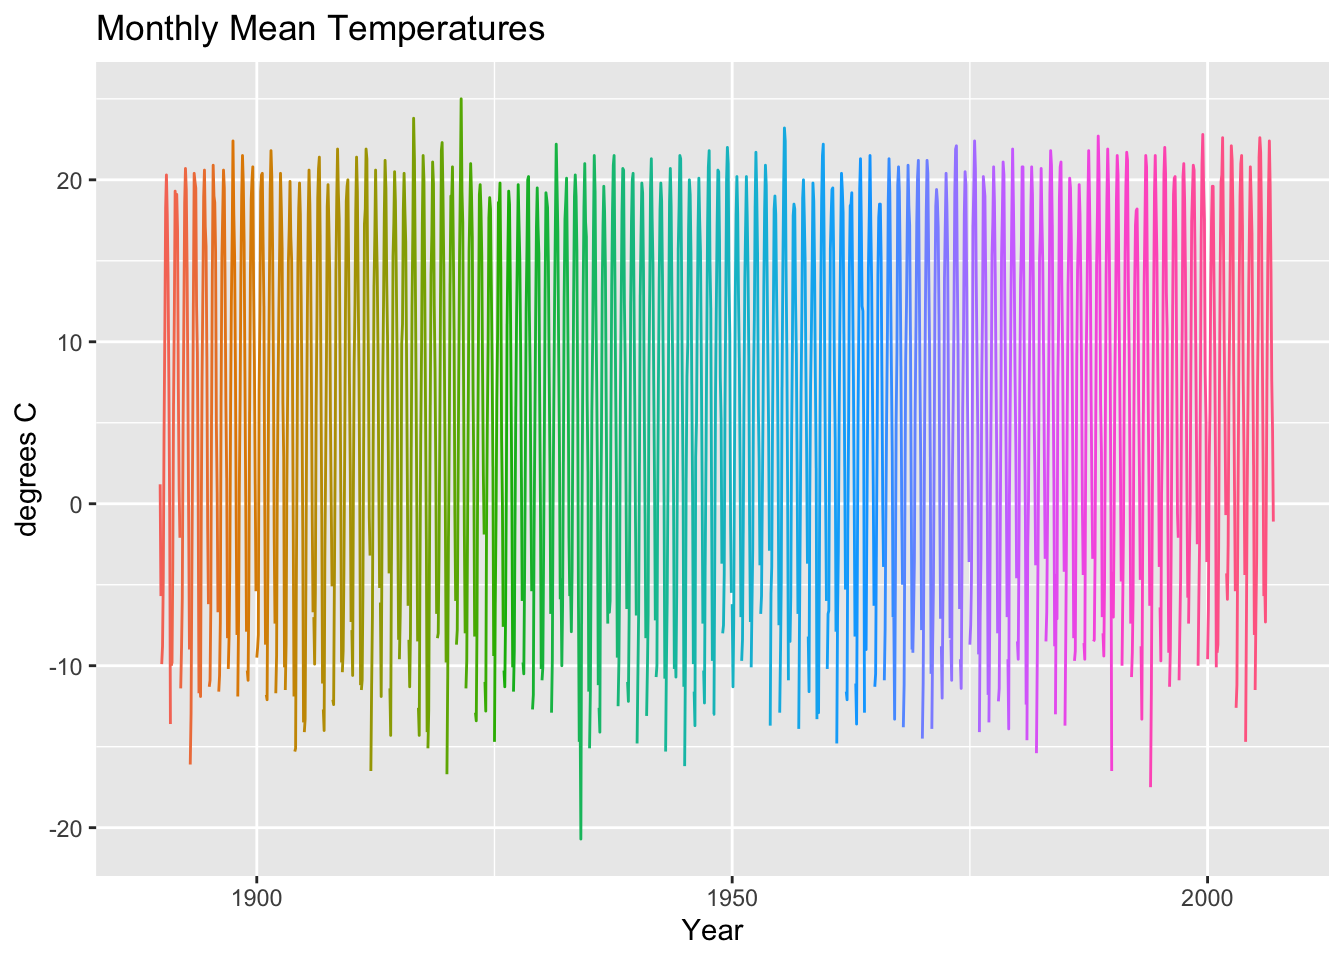
All_NA_cols = apply(data_monthly,2,
                    function(x){sum(is.na(x))/length(x)})==1
Data details
- Temperature units are in Celcius.
- Monthly values can be derived from daily ones.
- The speed of maximum gust is in kilometers per hour.
- Heat degree days is the number of degrees Celsius that the mean temperature is less than 18 Celcius, the cool degree days is a number of degrees Celsius that the mean temperature is equal to and above 18 Celcius.
- The direction of the maximum gust is in tens of degrees, 9 means 90 degrees, which is an east wind, and 36 means 360 degrees implies a wind blowing from the geographic north pole.
- Other appeared letters like “M” indicates a missing value, “^” indicates the value displayed is based on incomplete data. All legend is shown at the end of the data source page.