| education | median | average |
|---|---|---|
| High (secondary) school diploma or equivalency certificate | 40400 | 46920 |
| College, CEGEP or other non-university certificate or diploma | 49200 | 55650 |
| Bachelor’s degree | 64500 | 75800 |
| Master’s degree | 73500 | 88100 |
| Earned doctorate | 90000 | 102500 |
Labour Market Information
We present a new Labour Market Information (LMI) Report that provides a simpler and cleaner interface to visualize the data provided by Statistics Canada on earnings in the post-secondary sector, with some contextual remarks1. LMI is an important consideration for academic programs development and renewals. Experience from Ontario University Fairs has consistently shown that job prospects upon graduation from academic programs are front and centre in the minds of prospective applicants. Notably, Skills and Jobs Outcomes is a priority area under Carleton’s SMA3 Agreement. In this context, the LMI Report can inform on high-level growth areas, insights on student training, and skills development with current and future employment prospects in Canada2. along with insights on the in-demand jobs and growth-oriented sectors that may influence International Student Allocations.
In this LMI, we have focussed on earnings data from Statistics Canada. When interpreting average annual earnings of Canadian graduates across academic disciplines, it is important to keep in mind that these figures reflect a combination of program-specific influences and selection-related factors, and should not be understood as a direct measure of the “value added” of individual programs.
On the program side, earnings differences capture the distinct skills and knowledge gained through academic study. Employers’ willingness to pay varies depending on the technical, analytical, or professional competencies emphasized in each discipline. Market conditions, such as the demand for specialized expertise, the degree of competition across sectors, and the availability of alternative career paths, further shape the compensation graduates receive. In some fields, strong outside options and diverse career trajectories may contribute to higher observed earnings.
Equally important are selection effects. Students entering higher-earning disciplines often arrive with stronger prior grades, more extensive preparation in areas such as mathematics or sciences, and other forms of academic capital that influence both program entry and labor market success. Socio-economic background also plays a role, as access to resources, networks, and opportunities can affect educational choices and subsequent earnings.
Taken together, the heterogeneity in earnings outcomes across disciplines reflects the interaction of program-based skill acquisition, labor market dynamics, and the characteristics of the students themselves. These data should therefore be interpreted within this broader context, rather than as a simple ranking of program quality or graduate success.
Indeed, differences in earnings across university disciplines are widely documented. Fields such as engineering, computer science, business, and economics often yield higher earnings than humanities or arts. Interpreting these earnings gaps, however, requires careful attention to selection effects: who enters which field, with what prior preparation, preferences, and constraints. Without accounting for selection, raw averages overstate or misattribute the causal effect of field choice.
The information can be used for different purposes.
- In providing information to prospective students and their families at the Ontario University Fair
- In thinking about curriculum design and program rejuvenation efforts
- In determining tuition fee structure for full cost recovery academic programs at Carleton
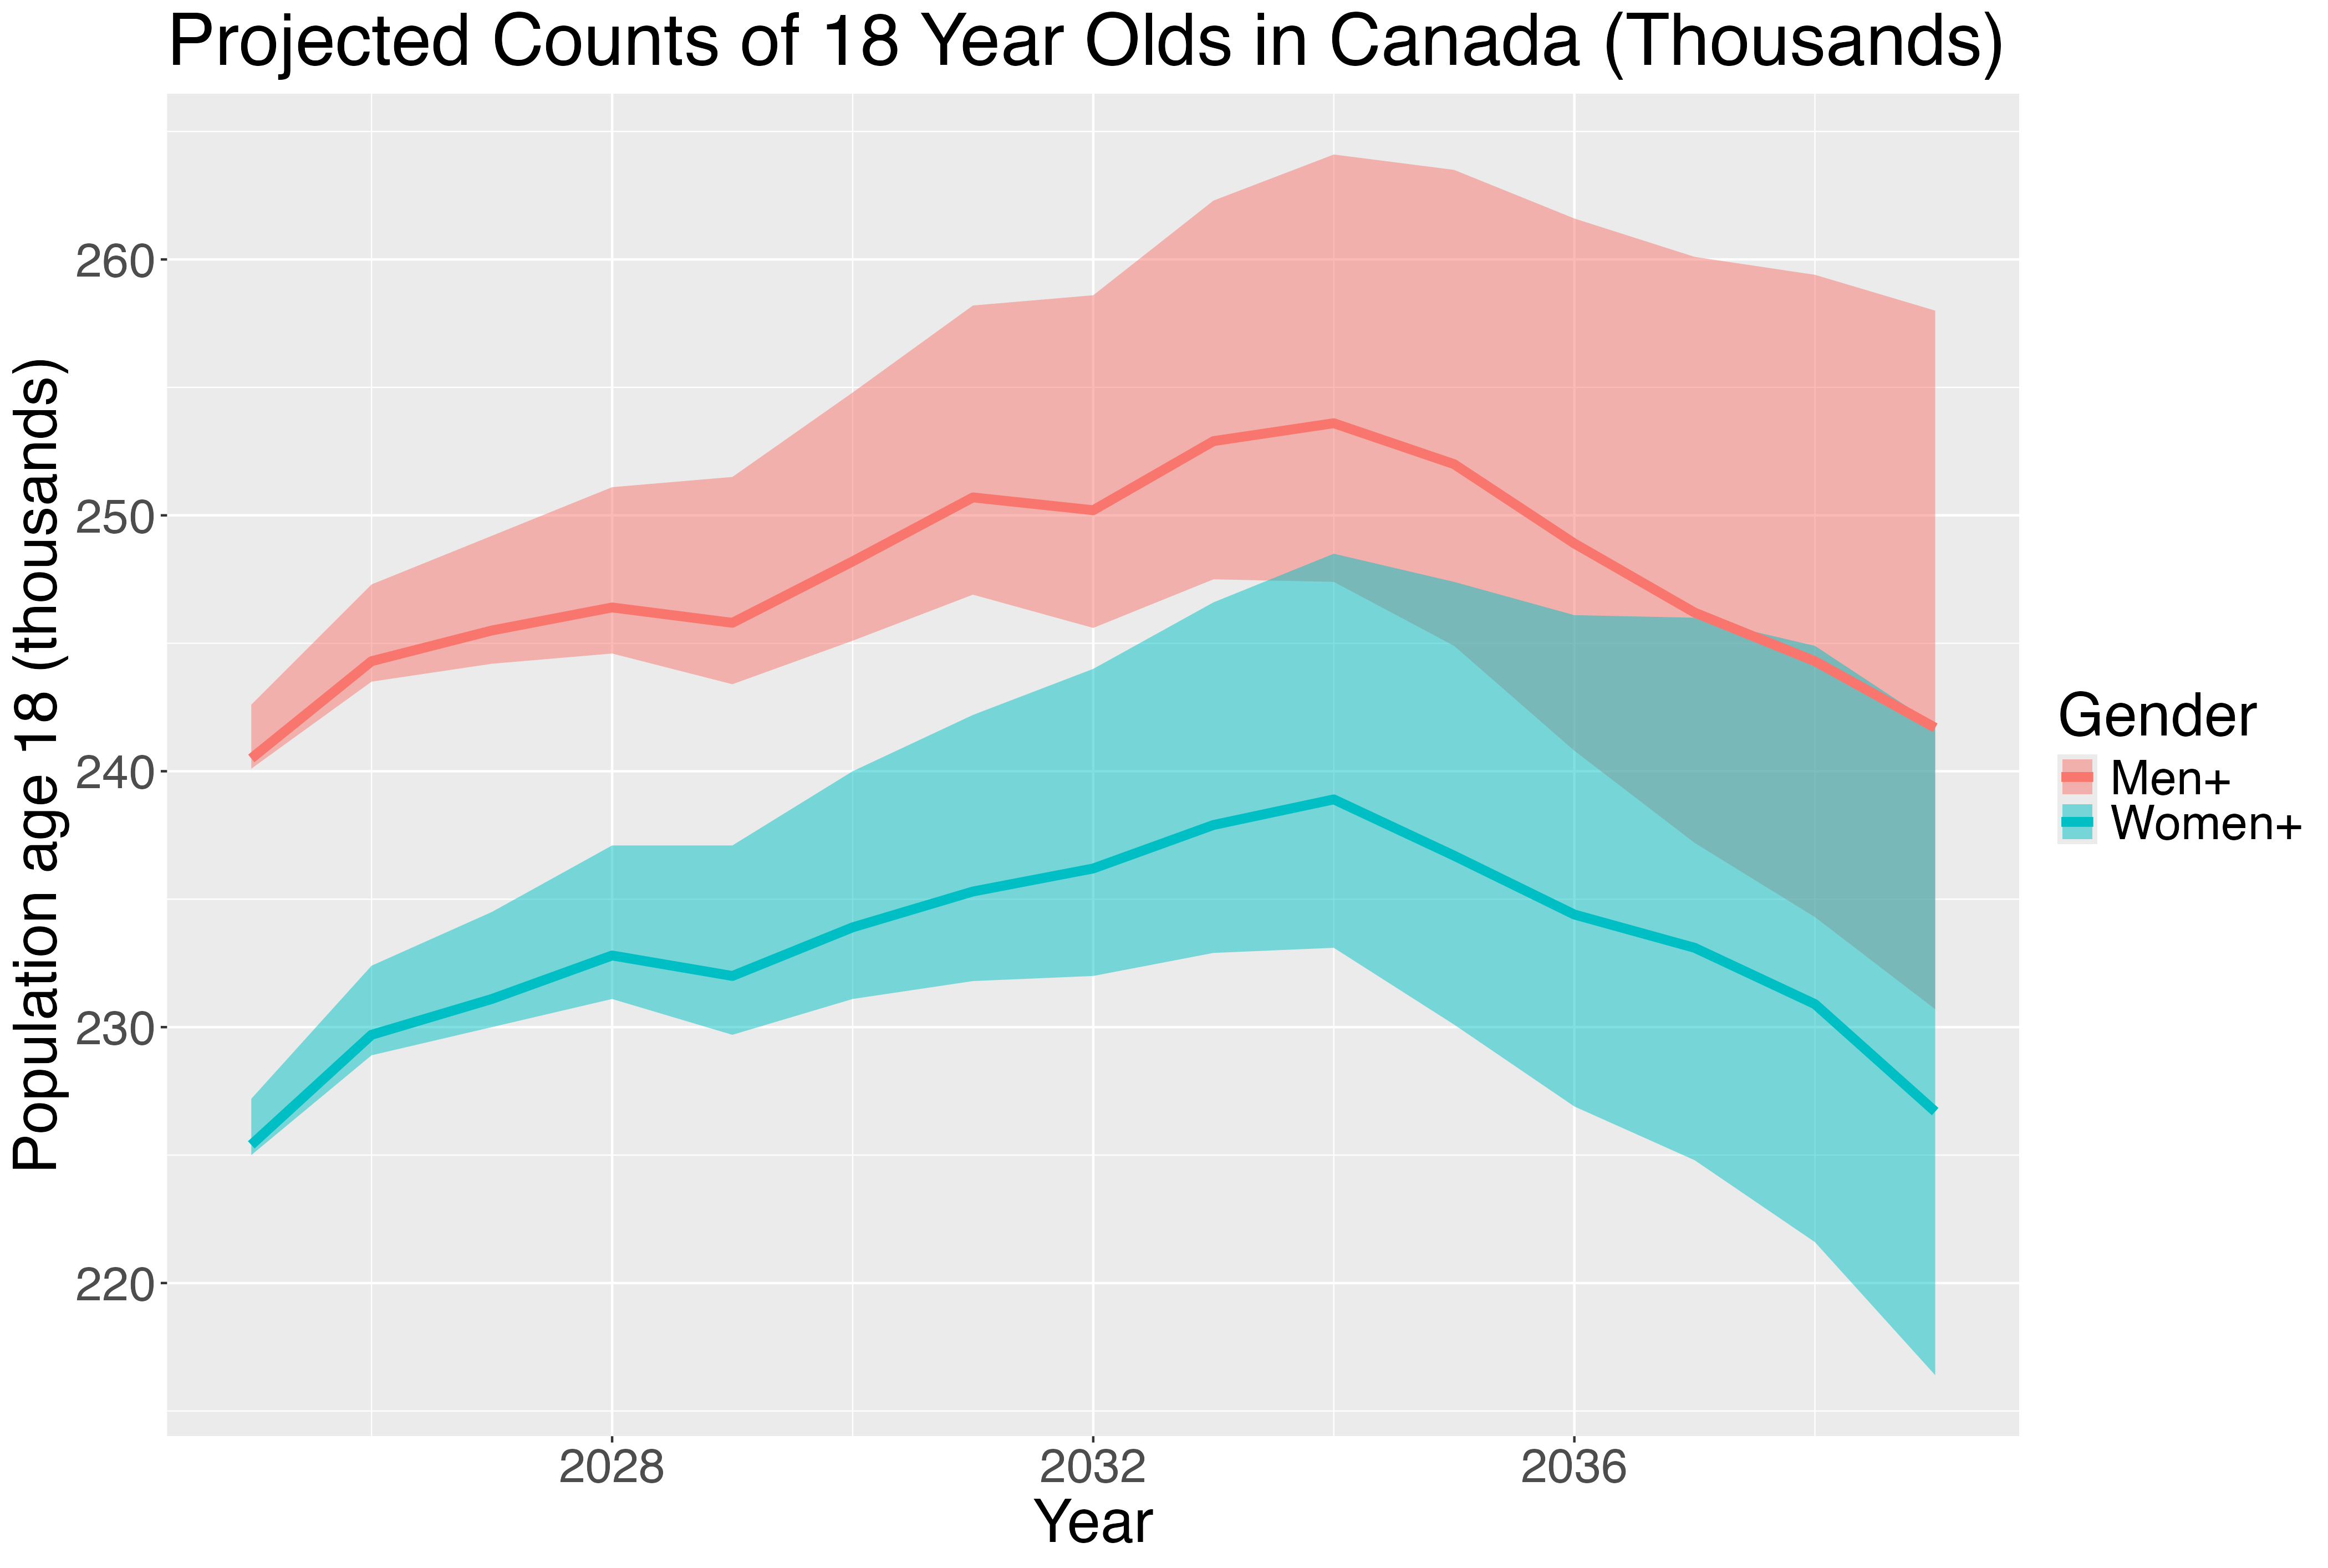
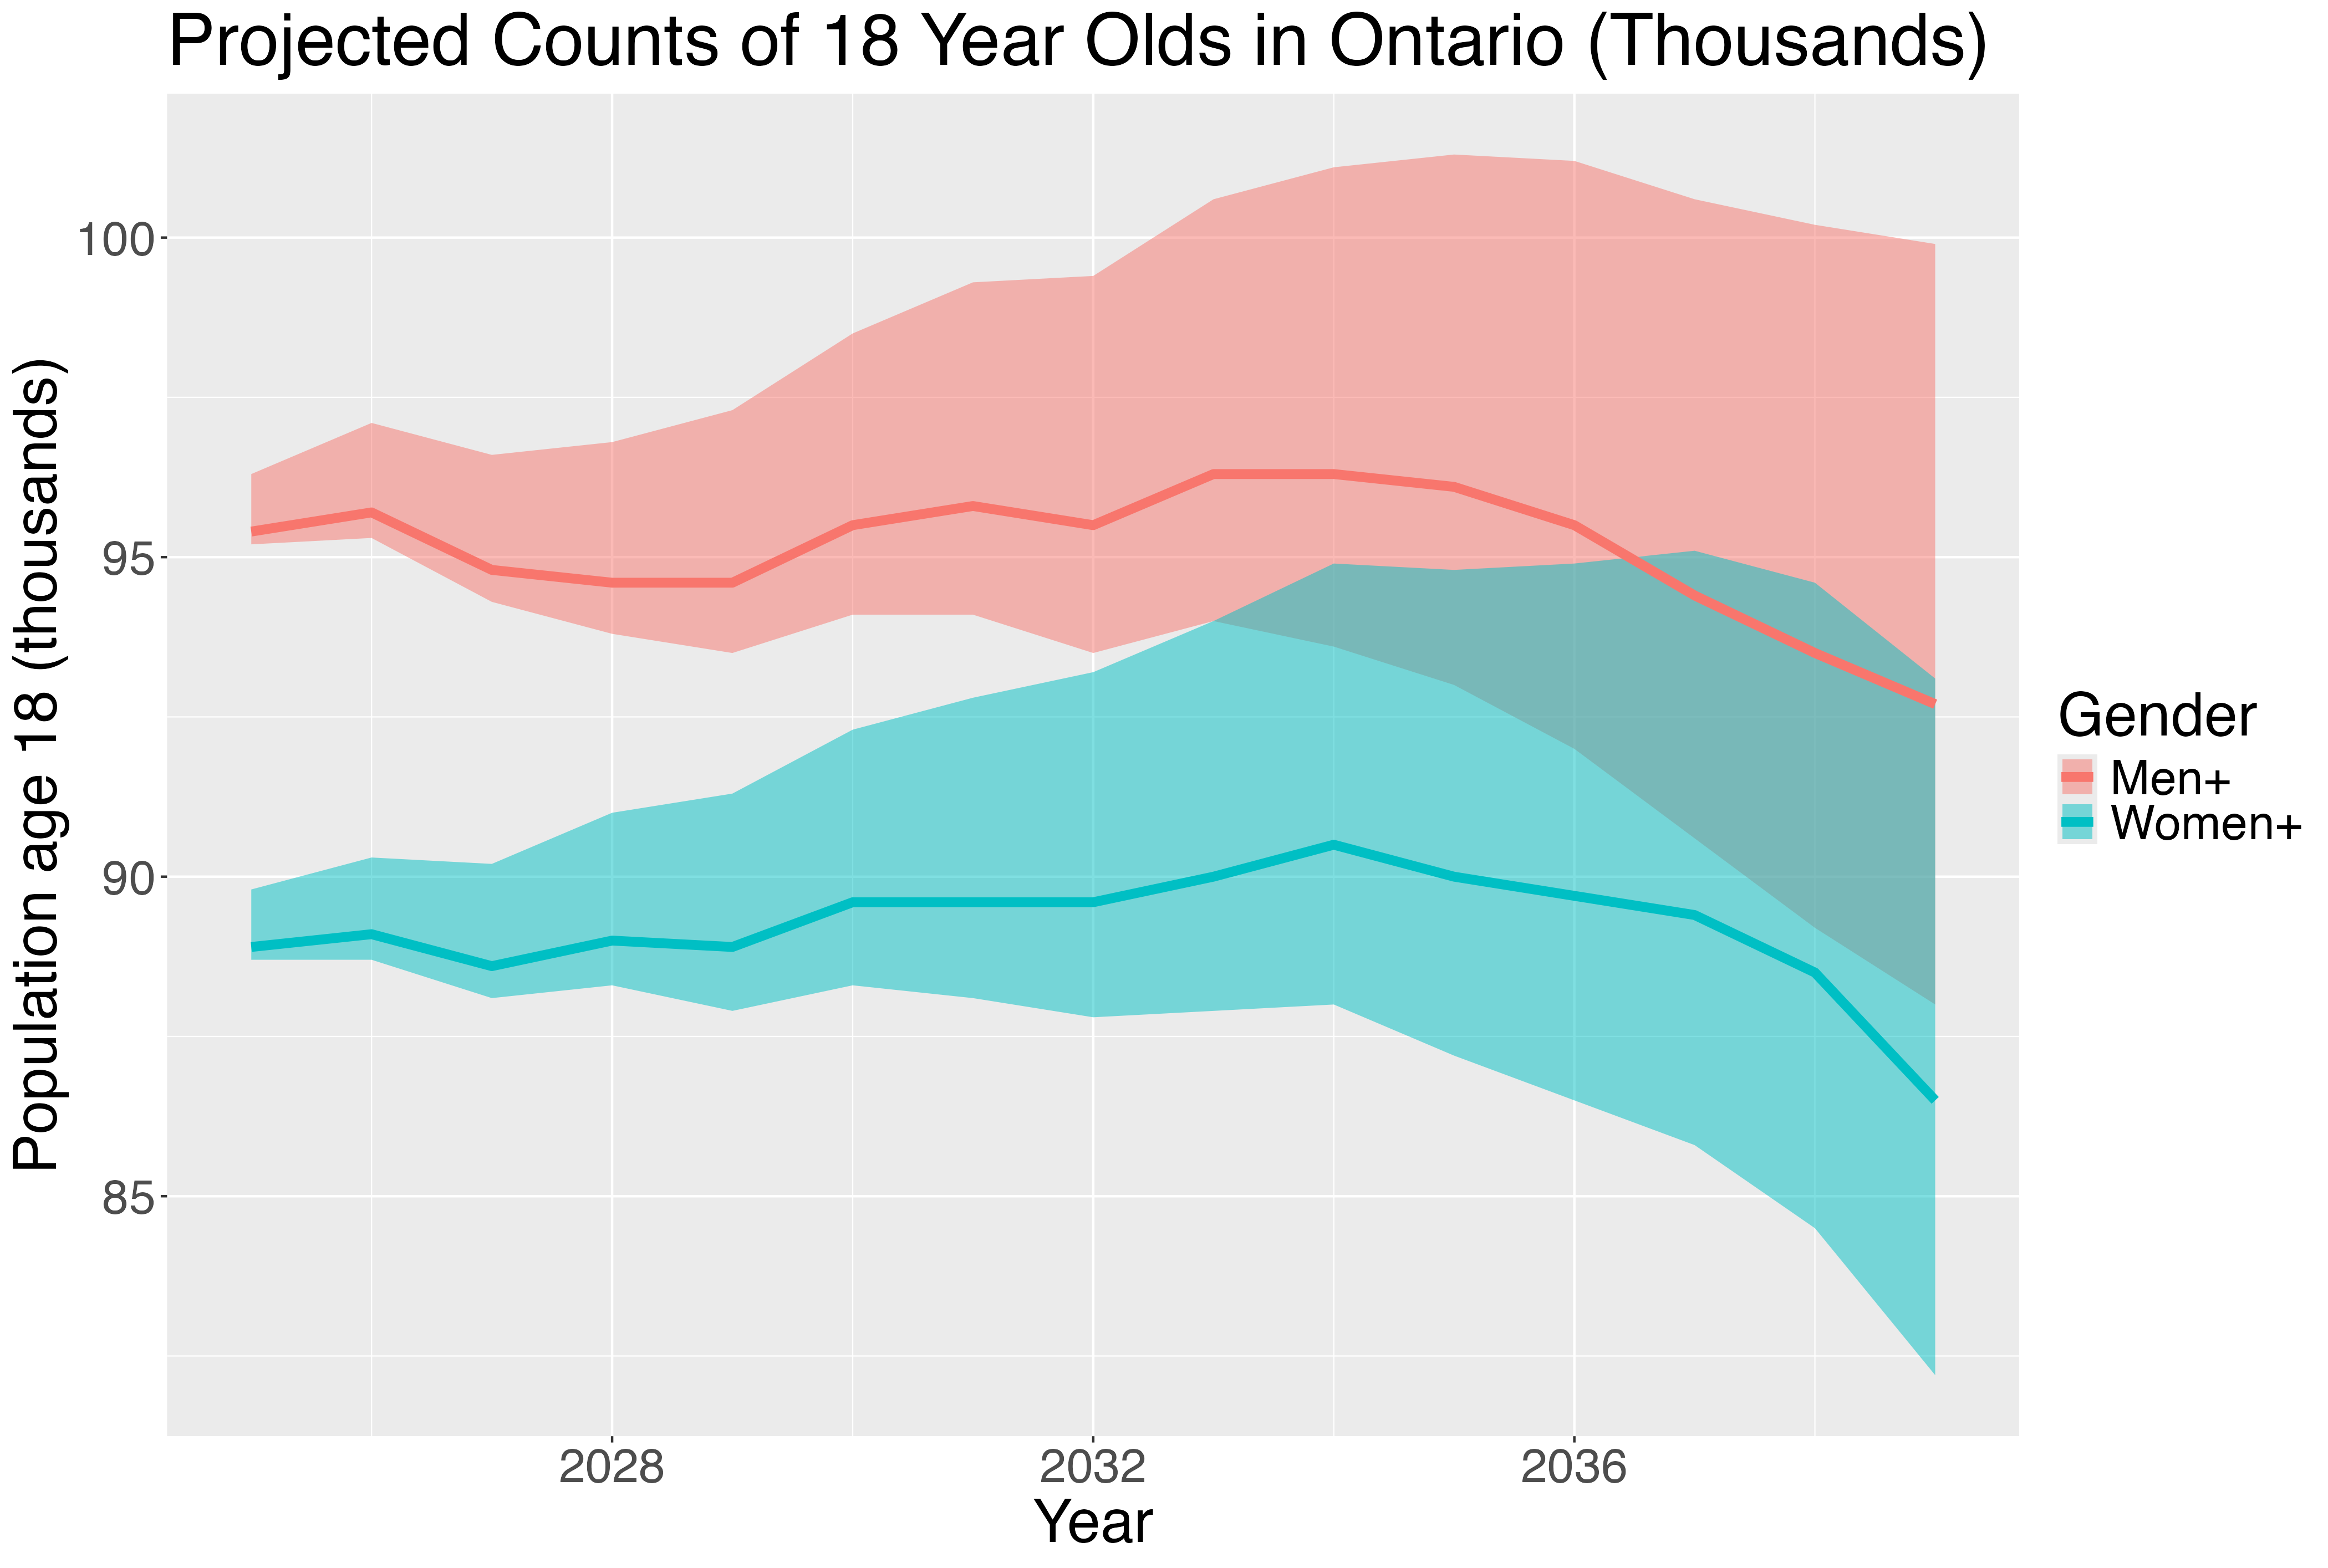
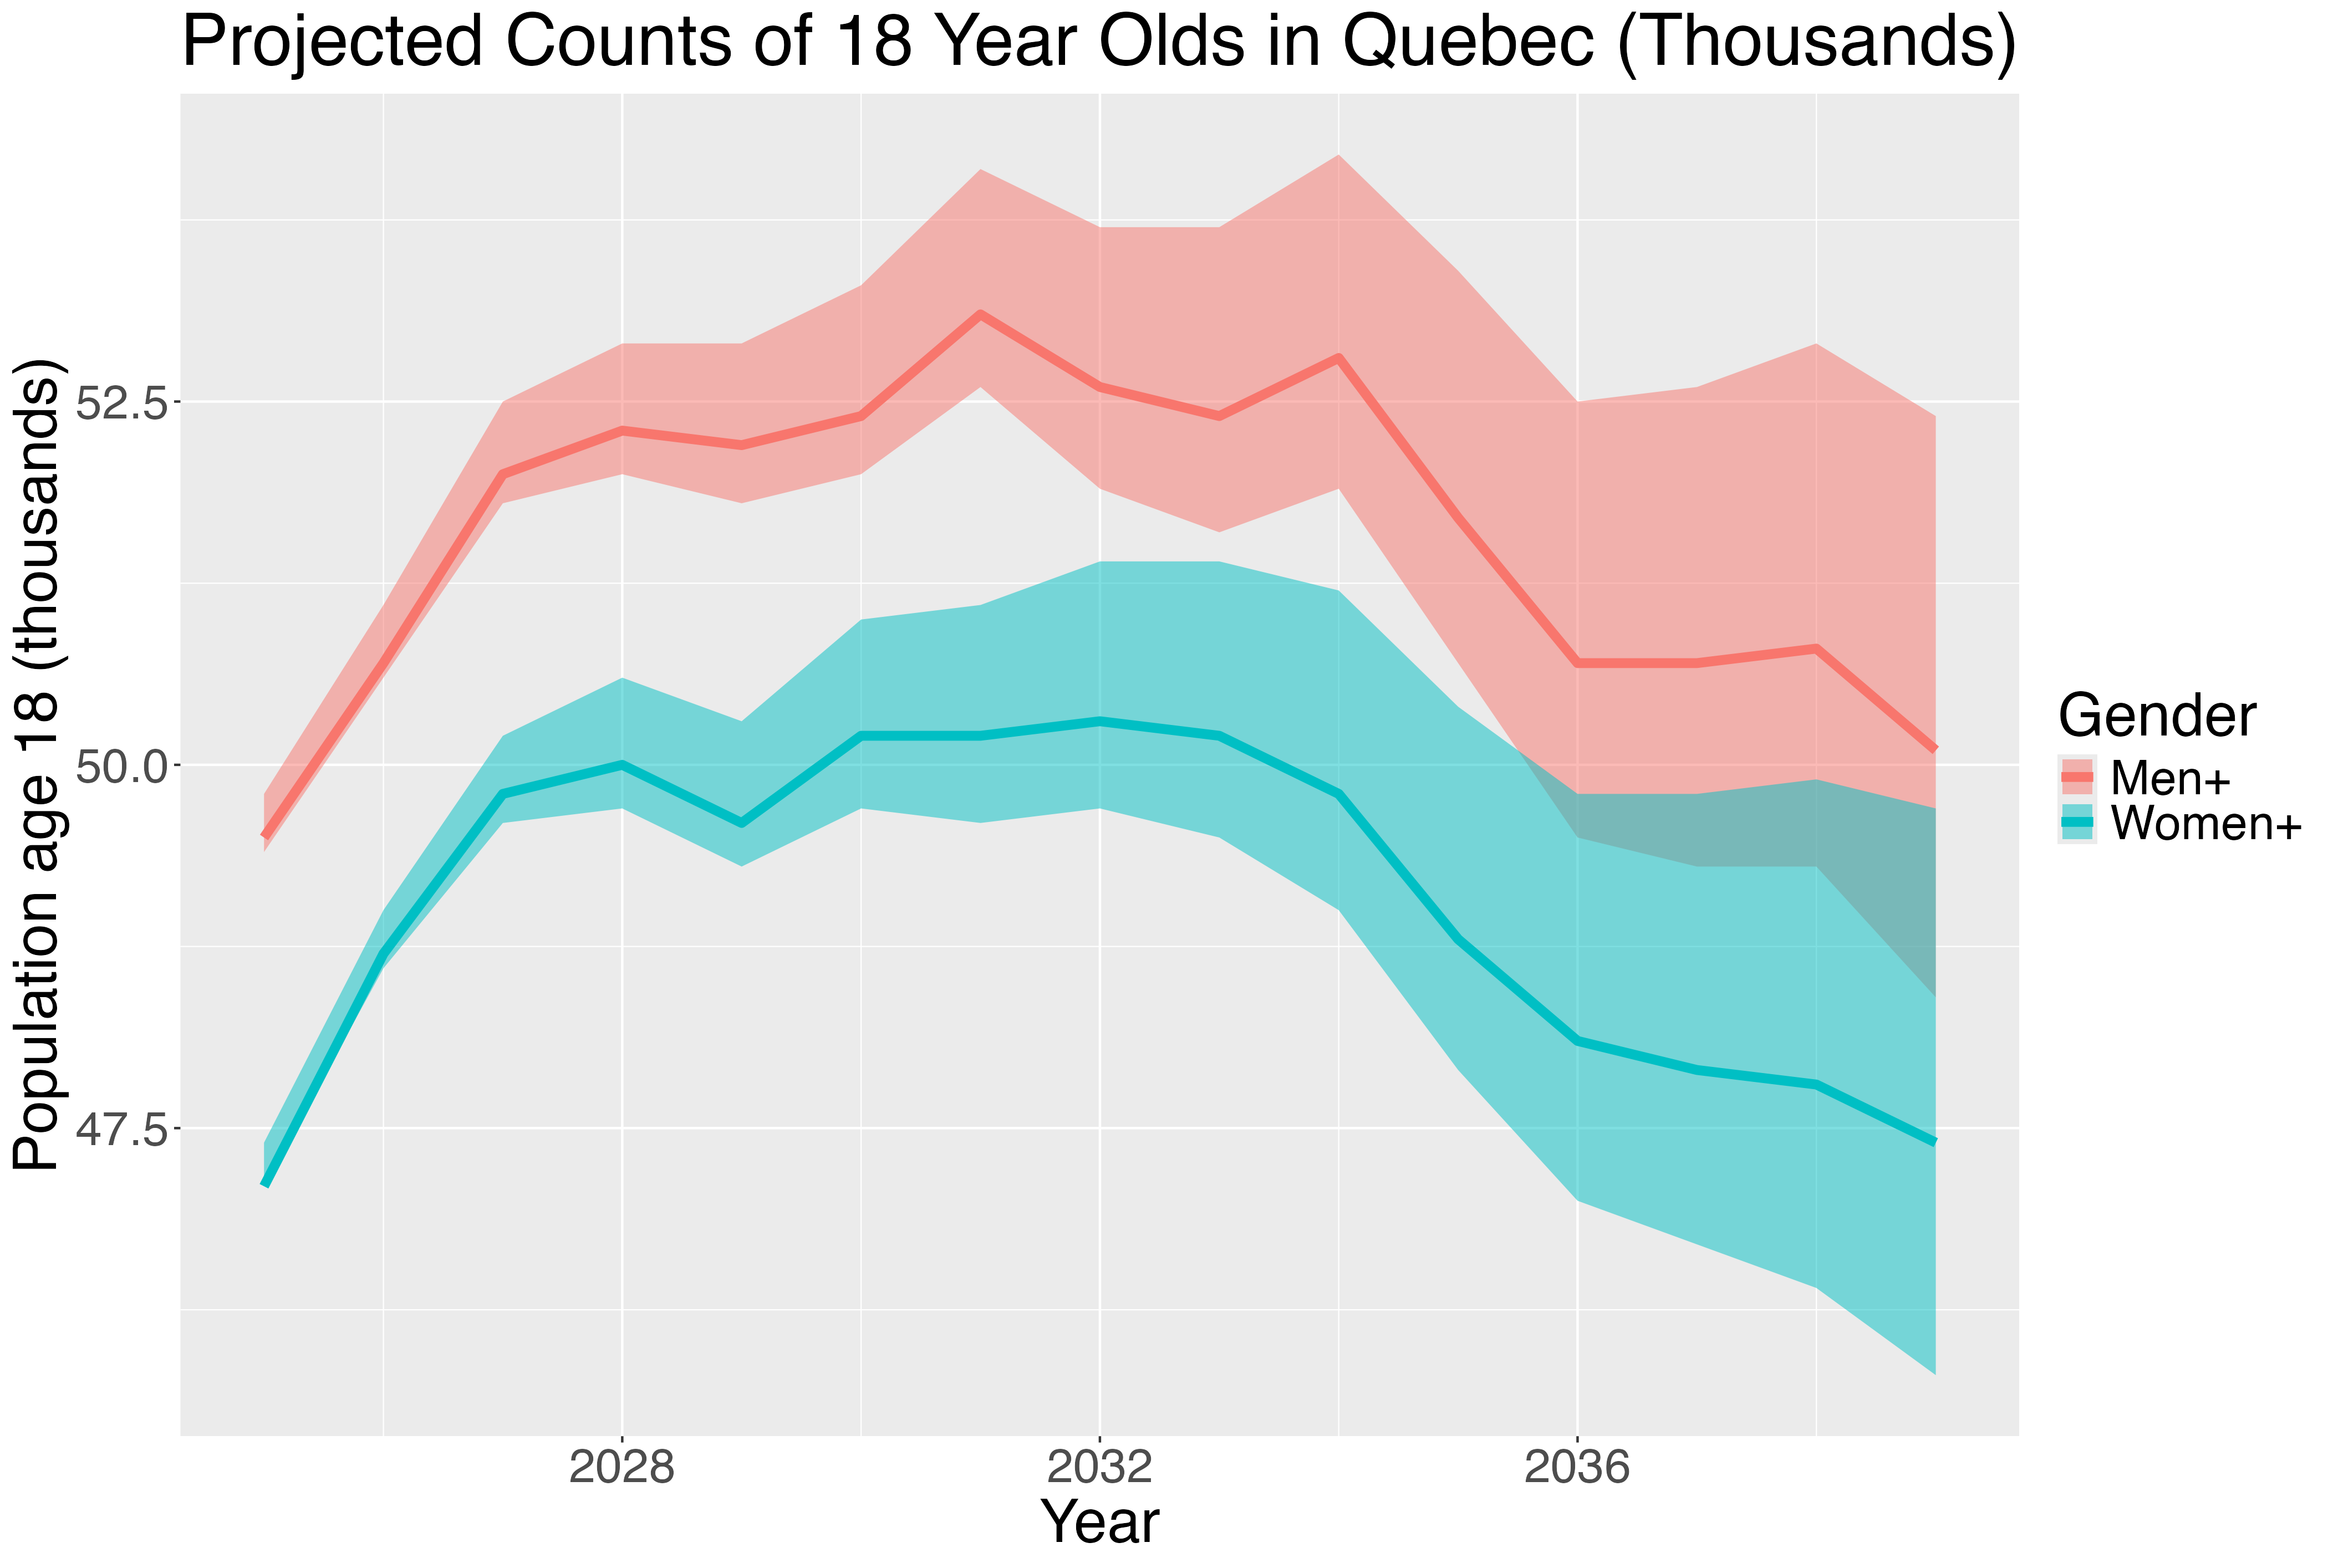
The `18 year olds’ cohort
Data source
Statistics Canada. Table 17-10-0057-02 Population projections of the Canadian population, for Canada, provinces and territories (x 1,000) https://doi.org/10.25318/1710005701-eng
Mid-range projections for cohort are based on the Projection scenario M1: medium-growth model. Upper and lower estimates come from the Projection scenario HG: high-growth and Projection scenario LG: low-growth models respectively.
The general demand for post-secondary education is expected to steadily increase, among both men and women, until the mid-2030s in Canada and Quebec, and increases slightly or remains relatively flat in Ontario.
Salary Outcome by Education Level
Typical Salary Per Education Level
The typical salary for individuals in Ontario aged 25-54 for different education levels is given in the table below.
Data source
The most recent data from Statistics Canada is from 2020. Salary data is for people living in Ontario aged 25-54.
Statistics Canada. Table 98-10-0411-01 Employment income statistics by highest level of education: Canada, provinces and territories, census divisions and census subdivisions DOI: https://doi.org/10.25318/9810041101-engHow Much of a Salary Difference Should You Expect From a University Degree Compared to College?
Difference in median hourly wages for jobs requiring a University education compared to jobs requiring a College education adjusted for inflation with respect to 2024 dollars. The dataset aggregates across all workers aged 25 to 54, demonstrating differences aggregated from entry level to senior positions.
Data source
Statistics Canada. Table 14-10-0417-01 Employee wages by occupation, annual DOI: https://doi.org/10.25318/1410041701-eng
Categorization and Education Details
The second digit of the NOC code provides insight into educational requrements of the role through the TEER categorization. When the second NOC digit is 1 the role requires a university degree or equivalent. When the second digit is 2 the role is TEER 2 and requires completion of a post-secondary education program of two to three years at community college, institute of technology or CÉGEP. For information on the NOC system and how the second digits define the educational requirements of the role, see page 11 of the National Occupational Classification (NOC) 2021 Version 1.0 pdf: https://www.statcan.gc.ca/en/12-583-x/12-583-x2021001-eng.pdf
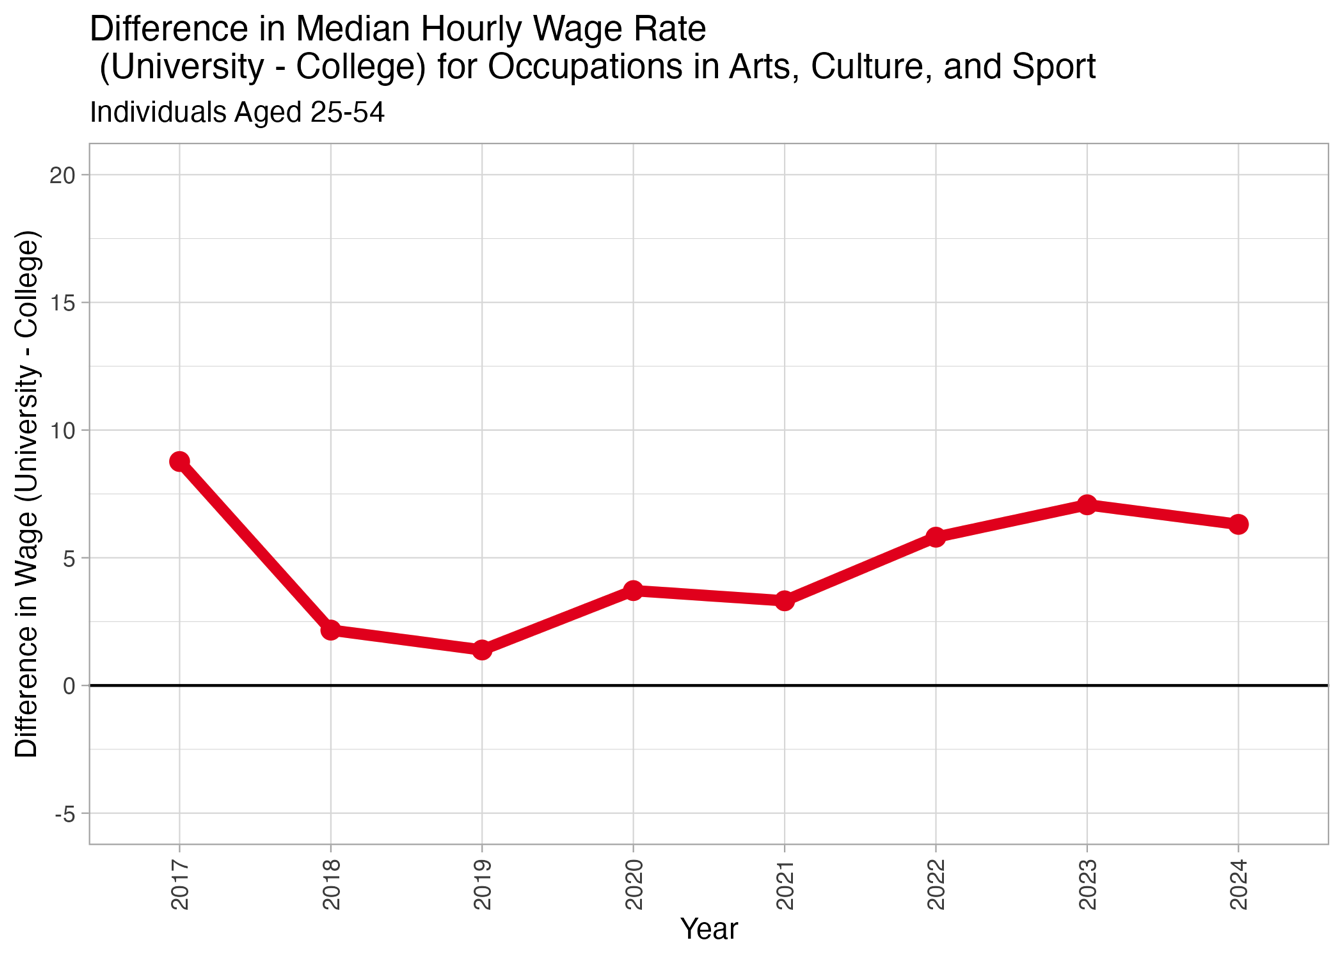
The median income for university-level occupations is from Professional occupations in art and culture (NOC 51). College incomes were obtained from Technical occupations in art, culture and sport (NOC 52).
Examples of university-educated careers include careers such as librarians, archivists, editors, and directors. College-education level occupations are described as technicians in the same fields as well as graphic and interior designers.
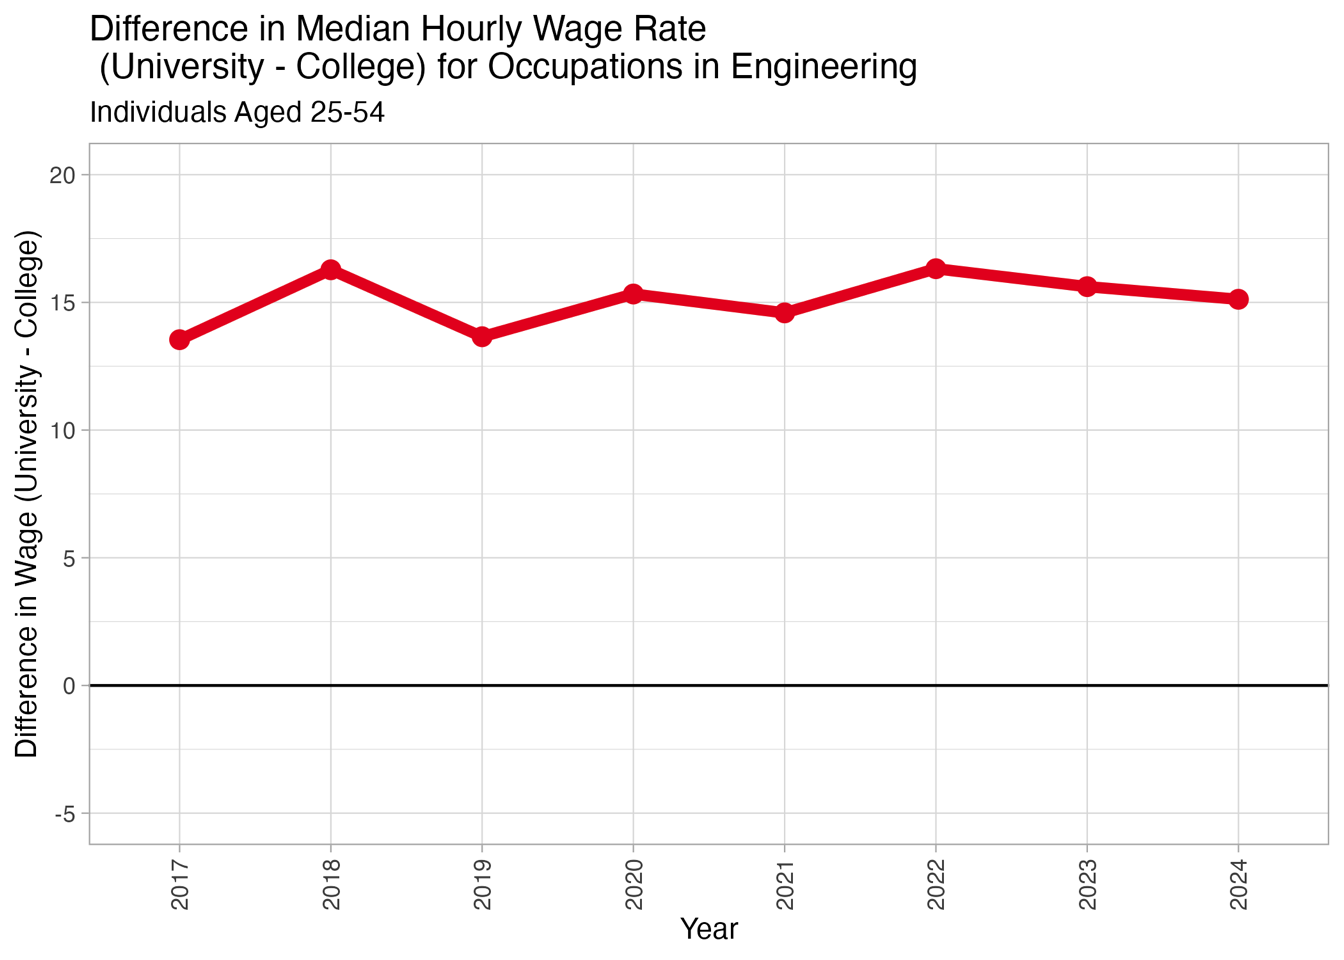
The median income for university-level occupations is from Professional occupations in engineering (NOC 213). College incomes were obtained from Technical occupations related to natural and applied sciences (NOC 22). There isn’t a direct college baseline so NOC 22 baseline. Engineering roles are highly regulated and require a university degree with a P.Eng. accreditation.
Note, due to the data’s categorization, architects and software engineers are not included in these values.
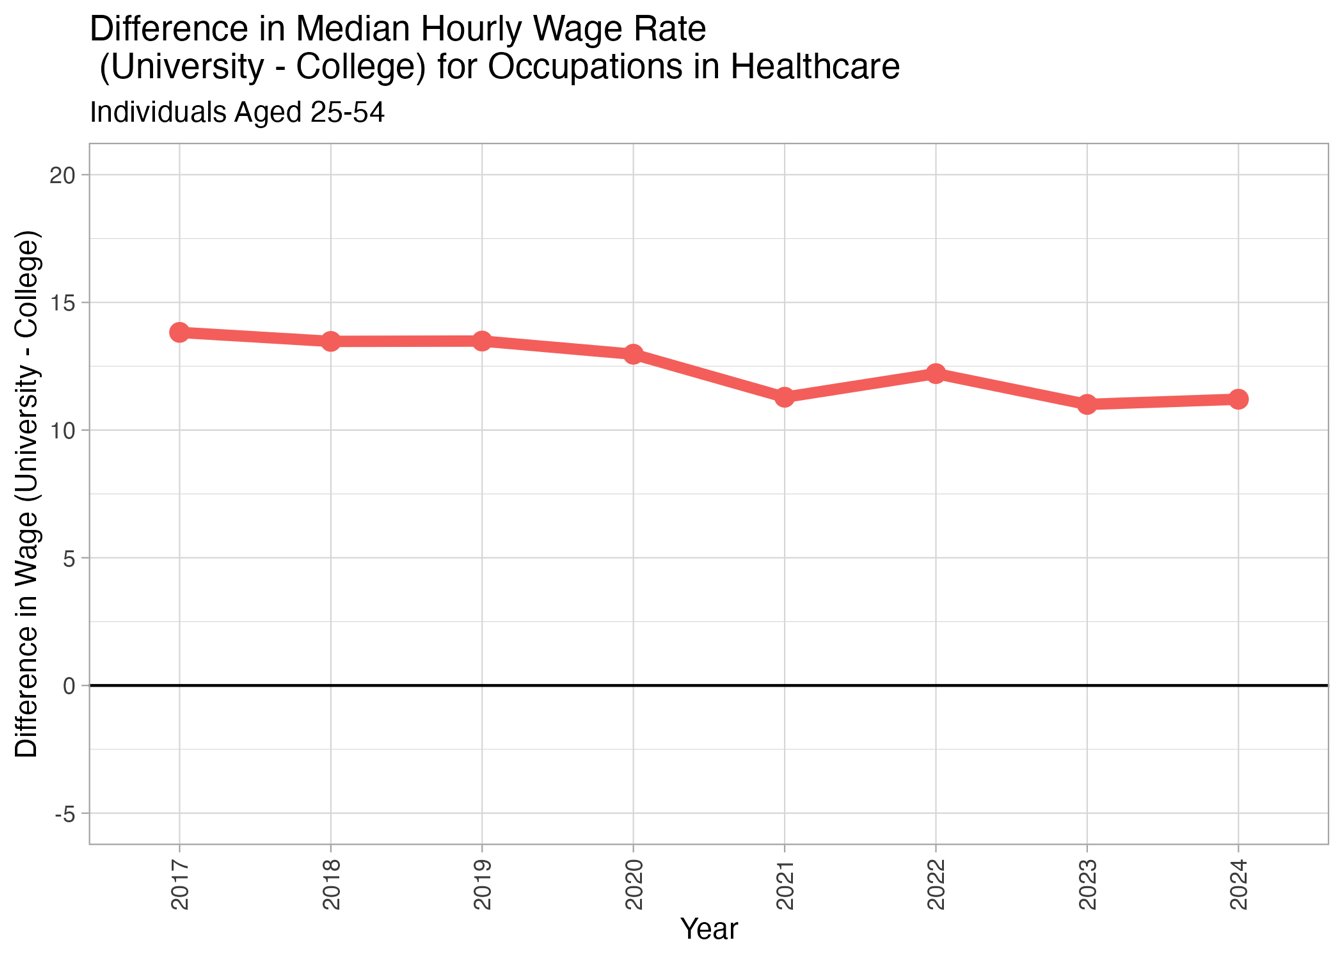
The median income for university-level occupations is from Professional occupations in health (NOC 31). College incomes were obtained from ** Technical occupations in health** (NOC 32).
University-educated occupations include careers such as physicians, dentists, psychologists, PTs, OTs, and nurses. College-educated occupations include technicians in the areas, dental hygienists, and practical nurses.
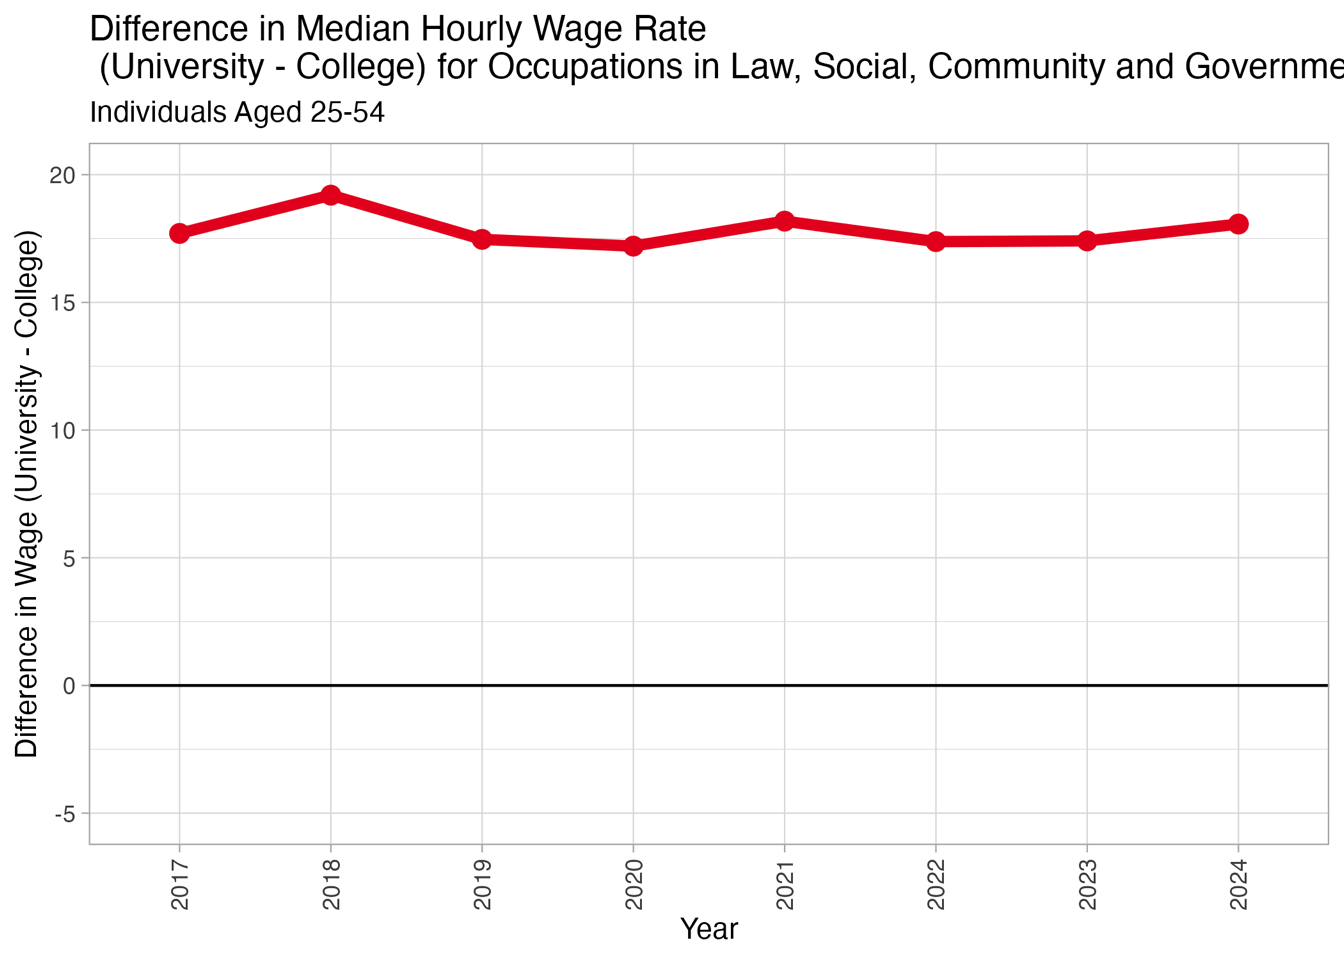
The median incomes from careers requiring university education in public and global affairs is compared to that of those in technical occupations in the field. Examples of university-educated careers include careers such as lawyers, counsellers, and policy and program analysts. College-education level occupations include front-line public protection and paraprofessional occupations.
The median income for university-level occupations was calculated by averaging Professional occupations in law (NOC 411), Professional occupations in social and community services (NOC 413), and Professional occupations in government services NOC(414). College incomes were obtained from Front-line public protection services and paraprofessional occupations in legal, social, community, education services (NOC 42).
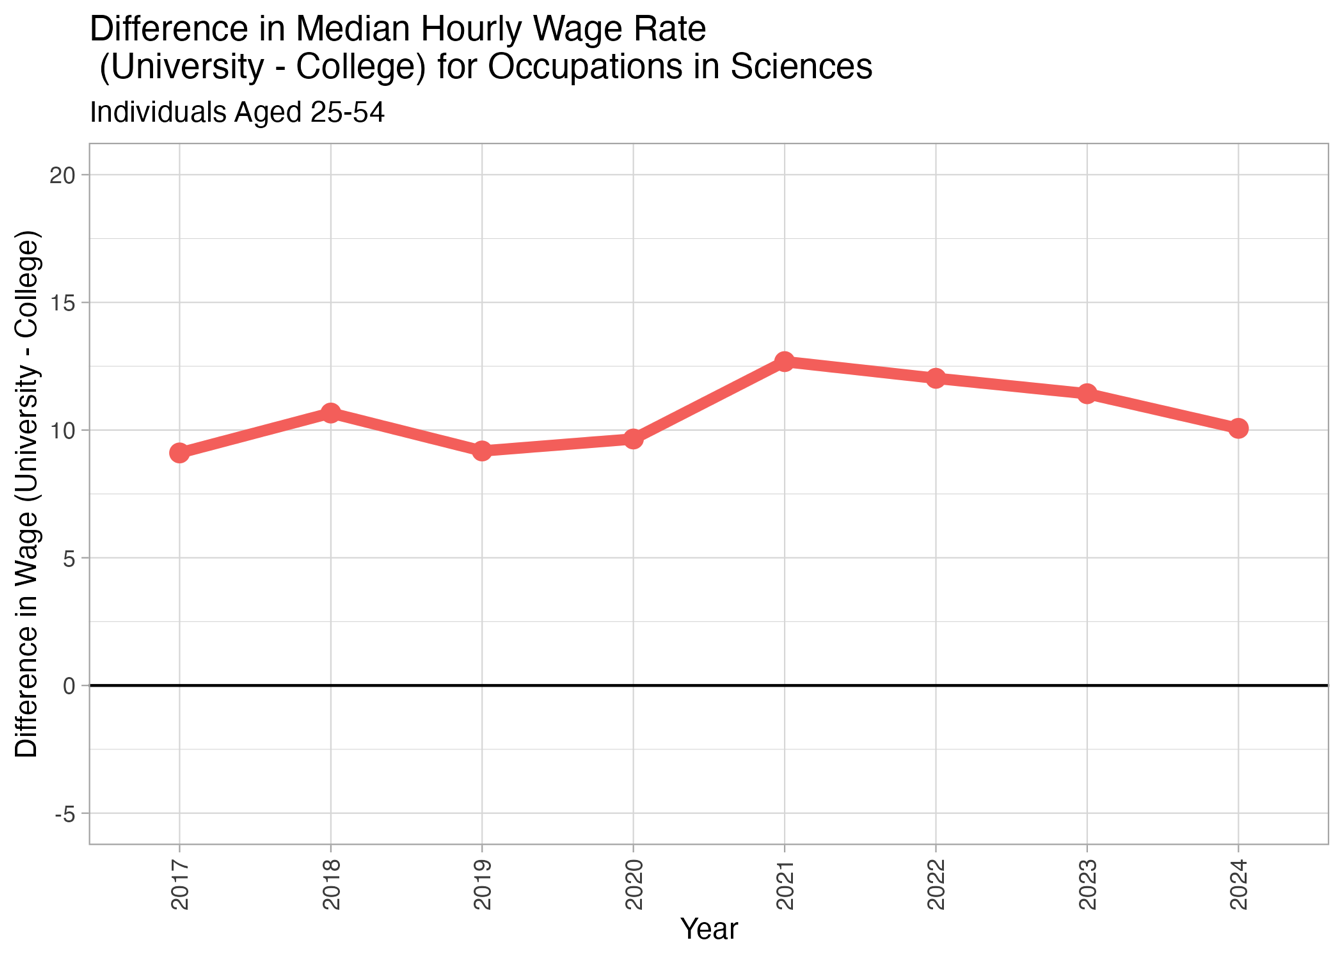
The median incomes from careers requiring university education in the natural and applied sciences is compared to that of those in technical occupations in the field. Examples of university-educated careers include careers such as scientists, actuaries, web developers, and data scientists. College-education level occupations are described as technicians or inspectors in the same areas.
The median income for university-level occupations was calculated by averaging Professional occupations in natural sciences (NOC 211) and Professional occupations in applied sciences (except engineering) (NOC 212). College incomes were obtained from Technical occupations related to natural and applied sciences (NOC 22).
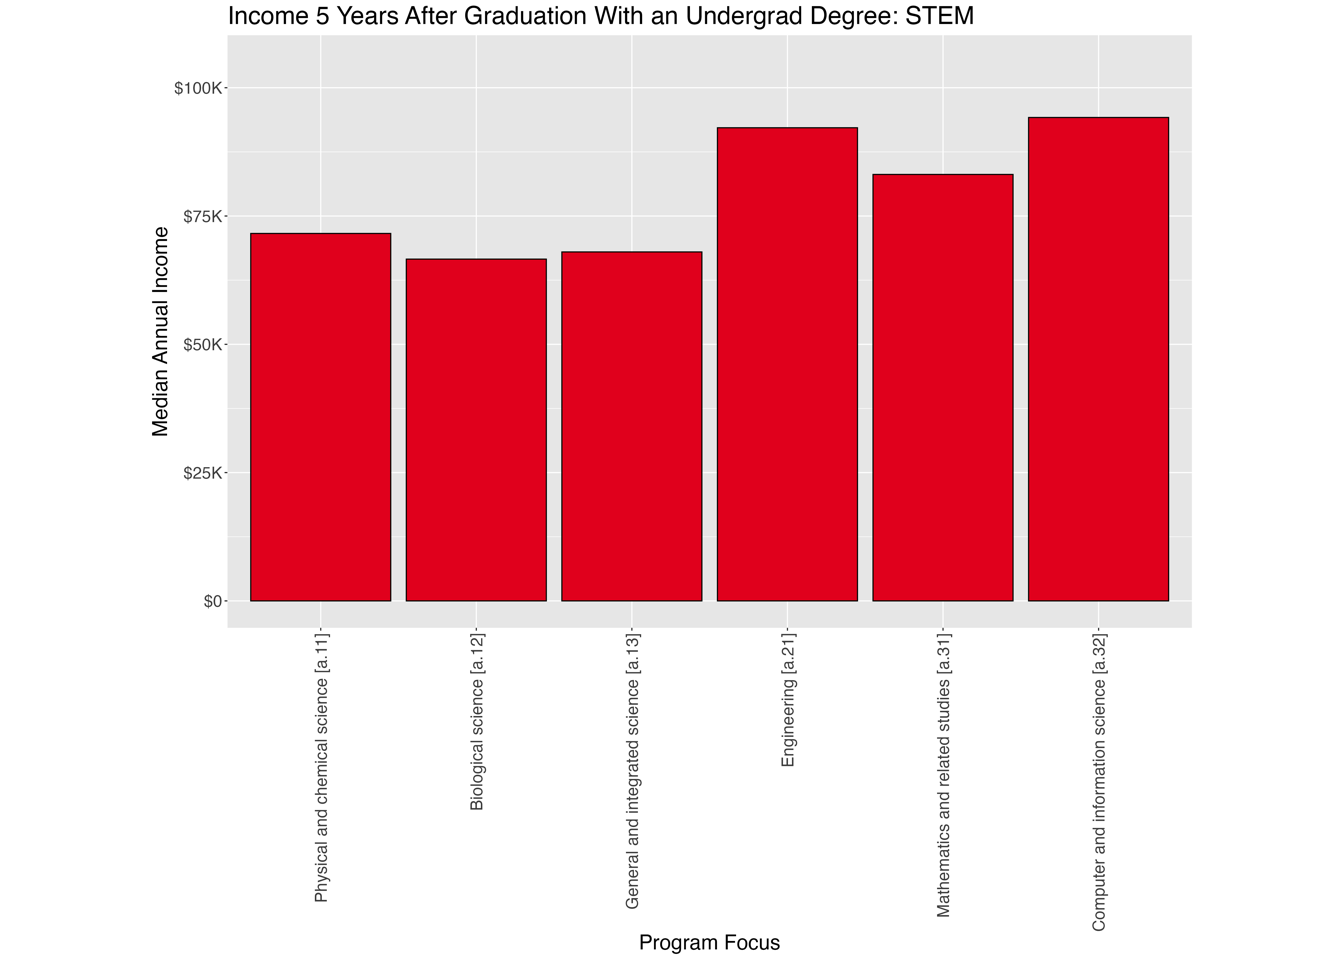
What is the median salary 5 years after graduating with a Bachelor degree?
Most recent available data from Statistics Canada is for 2023.
Data source
Statistics Canada. Table 37-10-0282-01 Characteristics and median employment income of postsecondary graduates five years after graduation, by educational qualification and field of study (STEM and BHASE groupings) https://doi.org/10.25318/3710028201-eng
Most recent data is from 2023.
Categorization of Educational Programs
The 2016 Classification of Instructional Programs (CIP) is used to classify the main field of study of postsecondary programs into Science, technology, engineering and mathematics (STEM) and Business, humanities, health, arts, social science and education (BHASE) groupings. https://www150.statcan.gc.ca/n1/pub/37-20-0001/372000012024001-eng.htm Classification is hierarchical, where extra digits on the right define subcategories of the left. Examine the hierarchy by exploring the CIP 2016 categories. The available salary data from Statistics Canada is coarsely grouped and isn’t as specific as we might want.

Example degrees in Business and related studies [b.11]
This group includes:
- Accounting
- Business/commerce
- Business administration, management and operations
- Business Economics, Financial Economics, and Management Economics
- Entrepreneurship/entrepreneurial studies
- Finance
- Human resources management
- International business/trade/commerce
- Marketing
Example degrees in Public administration [b.12]
This group only includes public administration degrees.
Example degrees in Arts [b.21]
This group includes:
- Audiovisual communications technologies/technicians
- Visual and performing arts
- Dance
- Drama/theatre arts and stagecraft
- Music
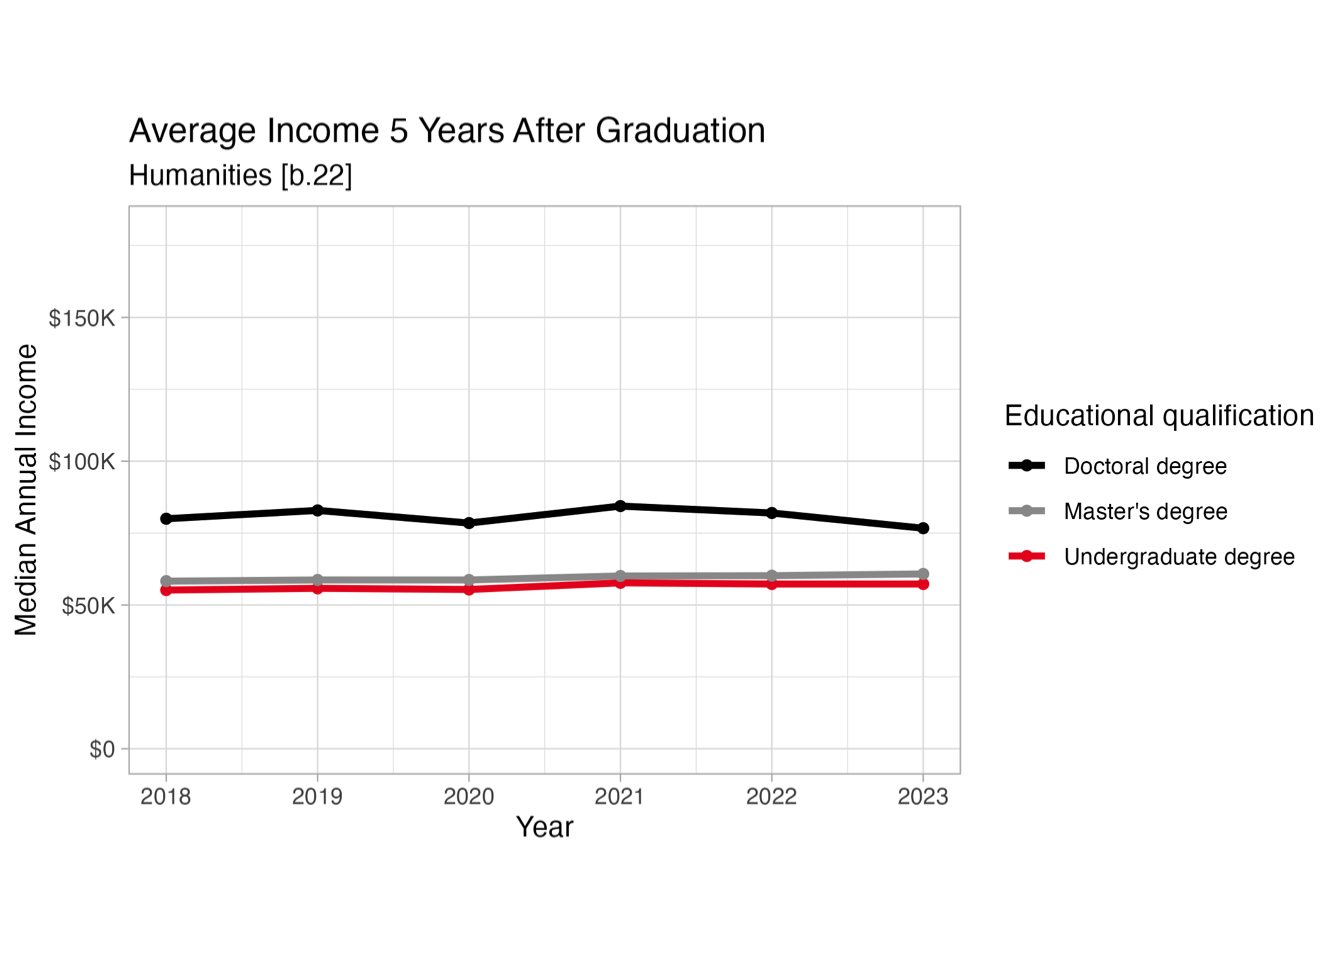
Example degrees in Humanities [b.22]
This group includes:
- Aboriginal and foreign languages, literatures and linguistics
- English language and literature/letters
- Humanities/humanistic studies
- Medieval and renaissance studies
- Philosophy and religious studies
- History
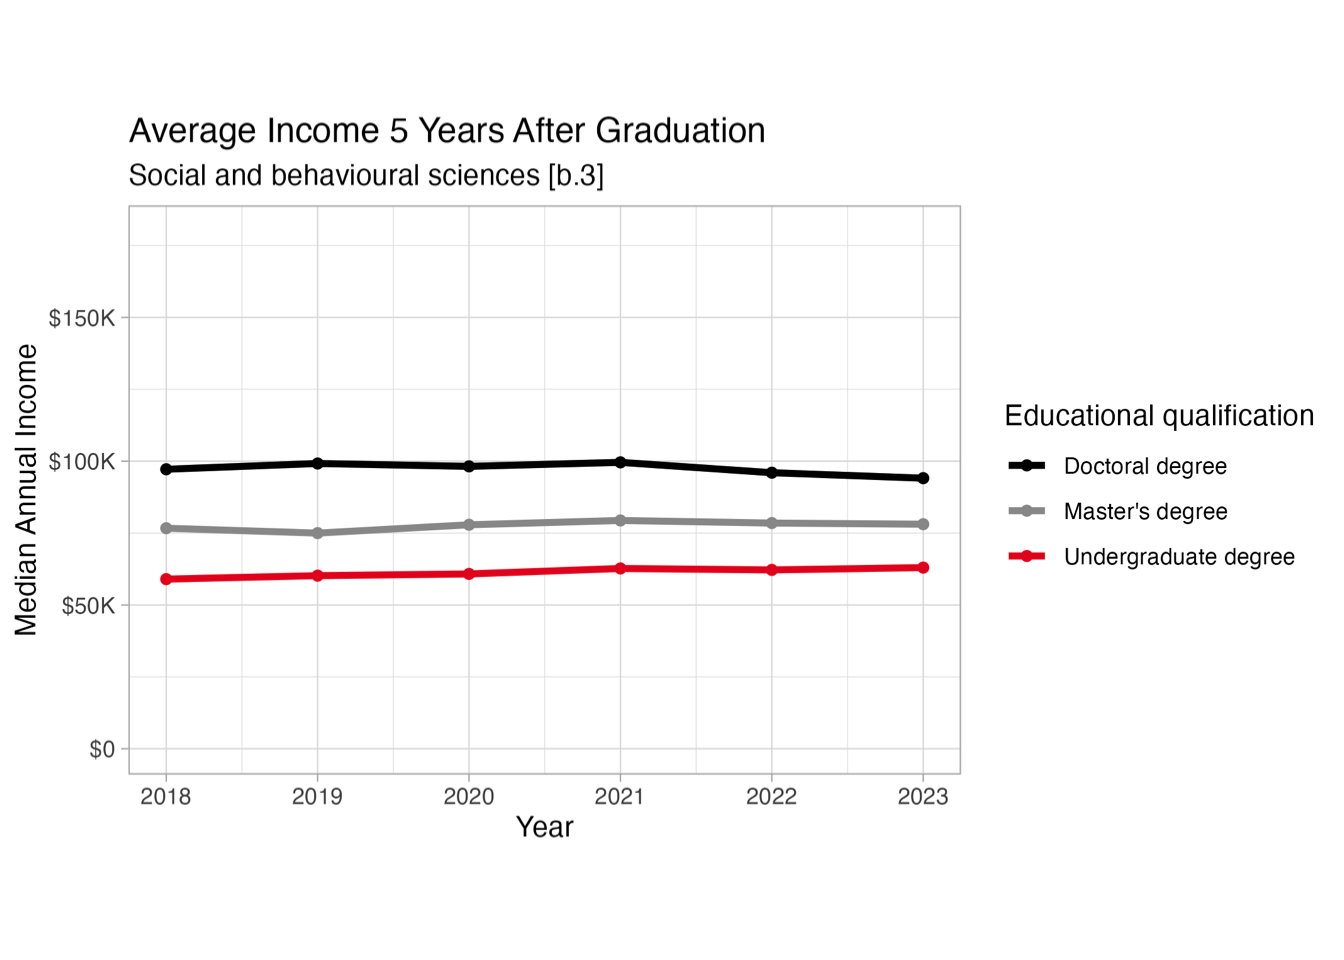
Example degrees in Social and behavioural sciences [b.3]
This group includes:
- Area, ethnic, cultural, gender, and group studies
- Communication, journalism and related programs
- Work and family studies
- Gerontology
- Behavioural sciences
- Psychology, general
- Public policy analysis (except cannabis)
- Social sciences, general
- Archaeology
- Criminology
- Economics
- Political science and government
- Sociology
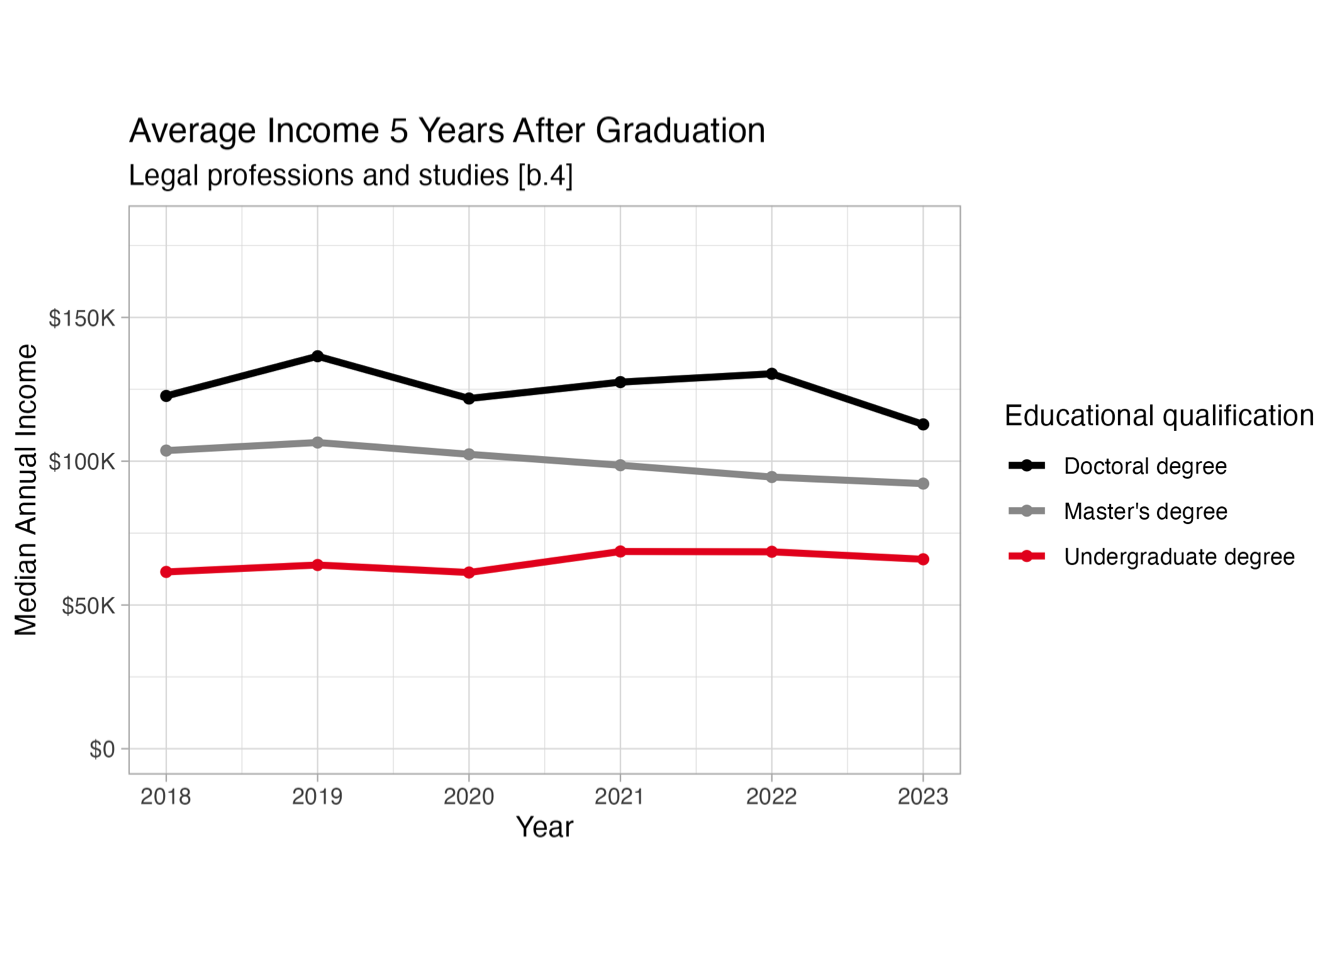
Example degrees in Legal professions and studies [b.4]
This group includes:
- Law (LLB, JD, BCL)
- Non-professional general legal studies (undergraduate)
- Legal support services
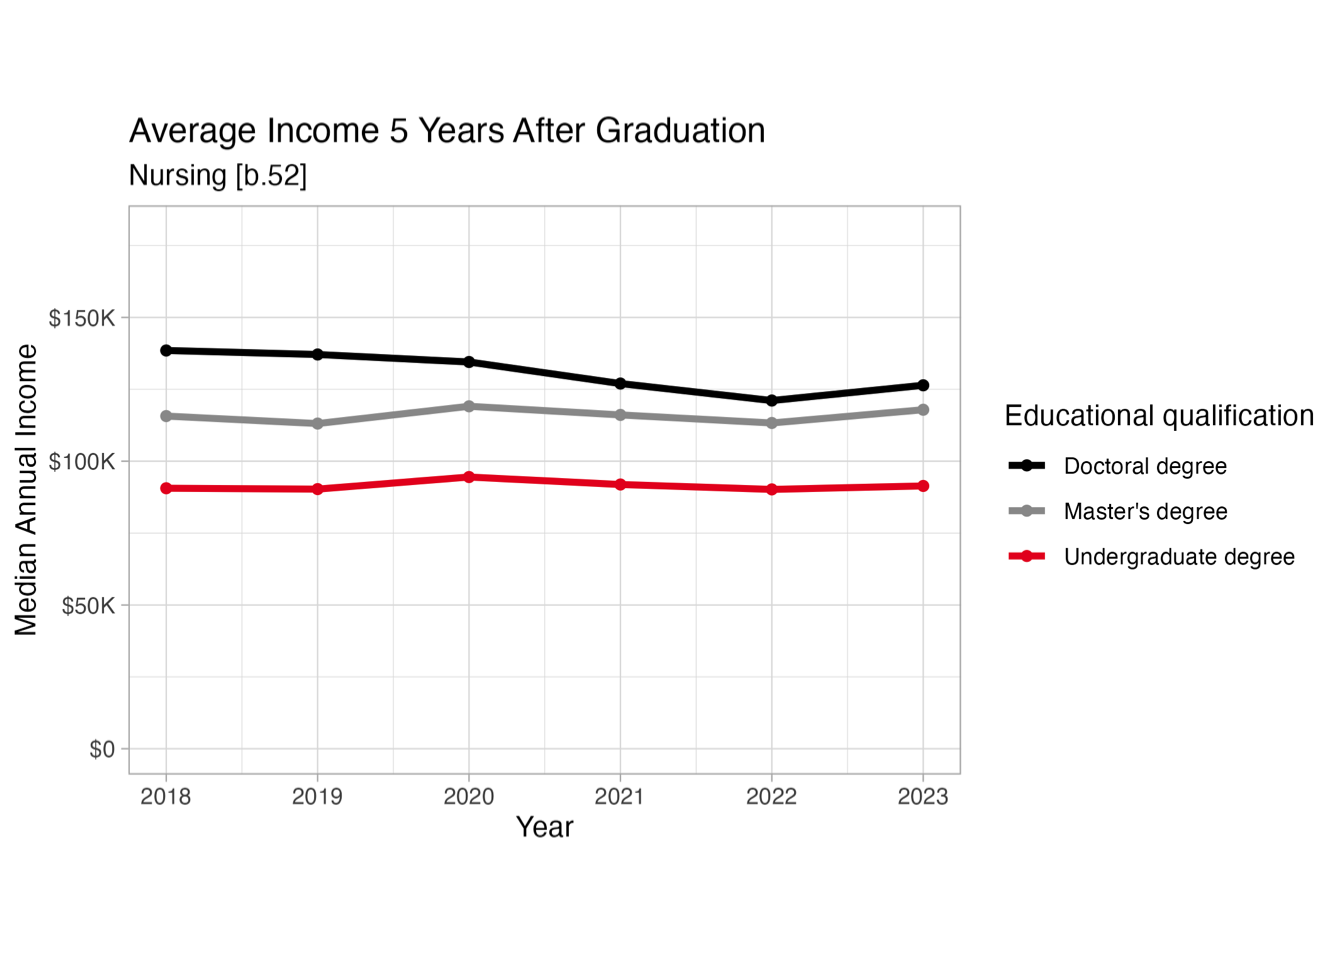
Example degrees in Nursing [b.52]
This group includes:
- Registered nursing, nursing administration, nursing research and clinical nursing
- Practical nursing, vocational nursing and nursing assistants
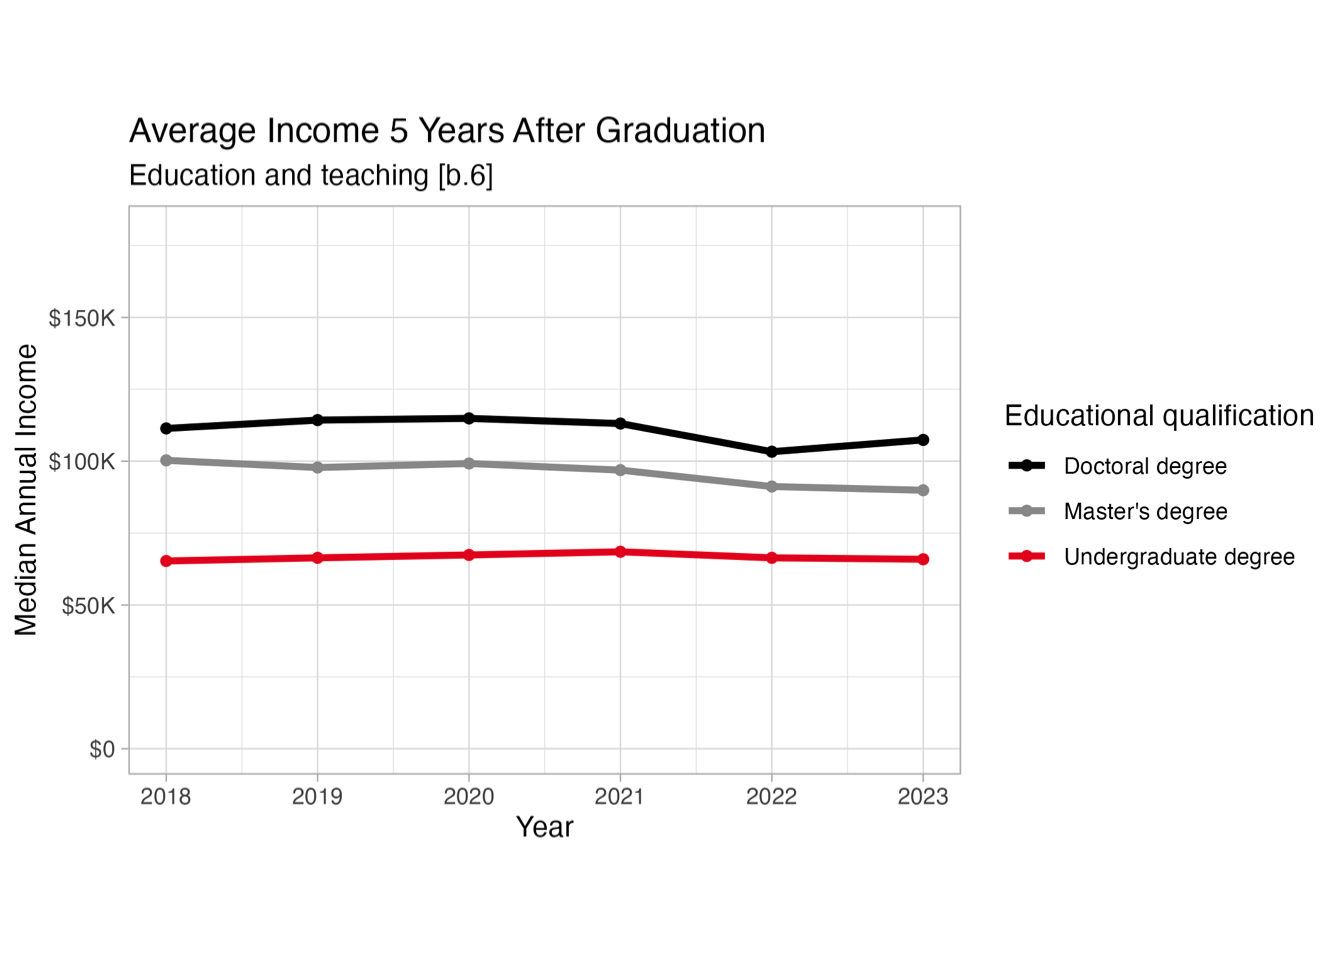
Example degrees in Education and teaching [b.6]
This group includes:
- Education, general
- Educational administration and supervision
- Student counselling and personnel services
- Teaching English or French as a second or foreign language
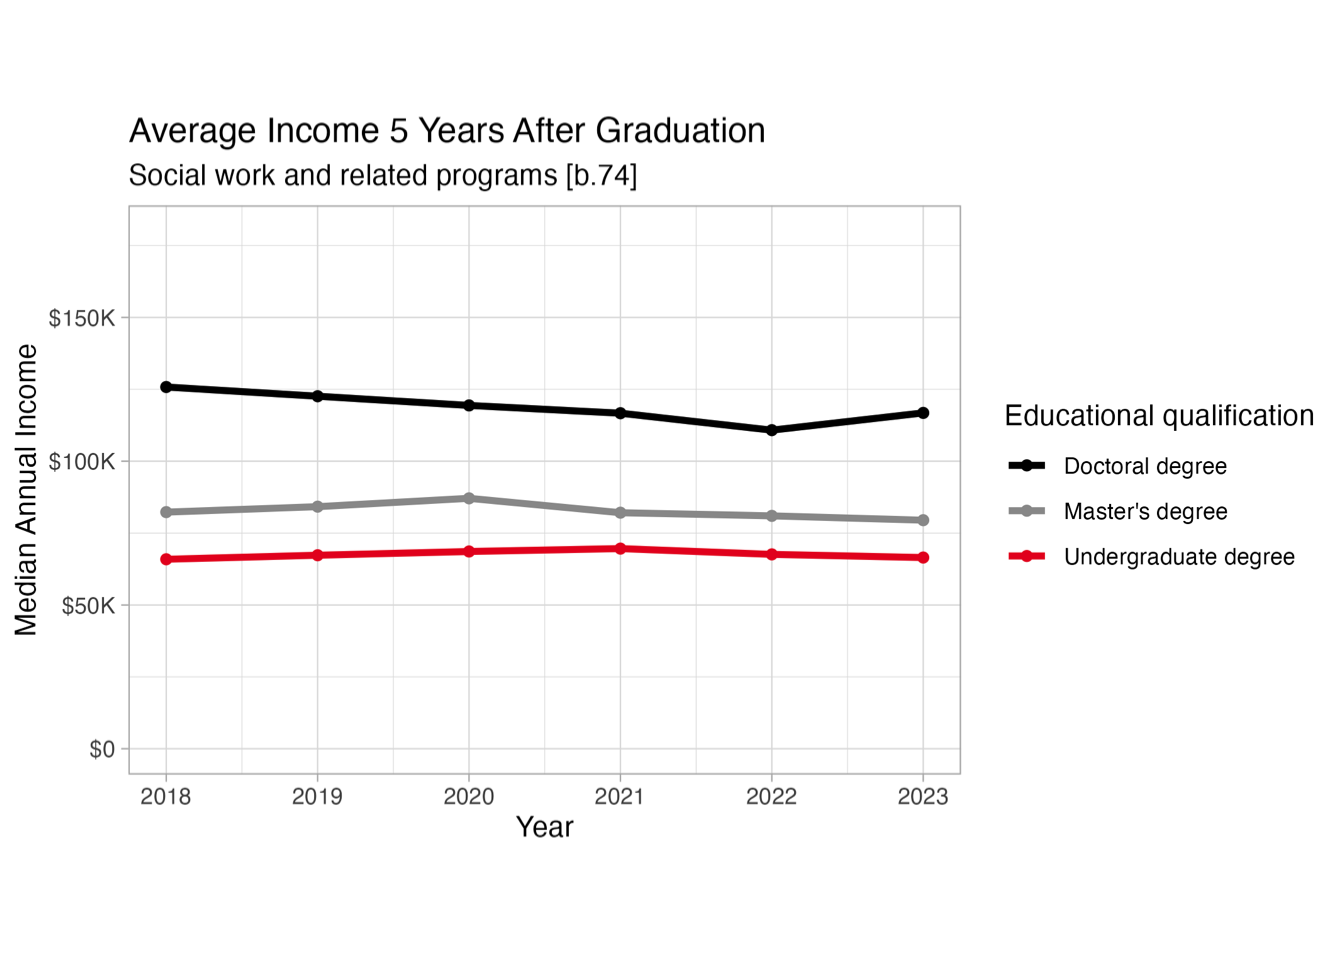
Example degrees in Social work and related programs [b.74]
This group includes:
- Social work
- Community organization and advocacy
- Youth services/administration
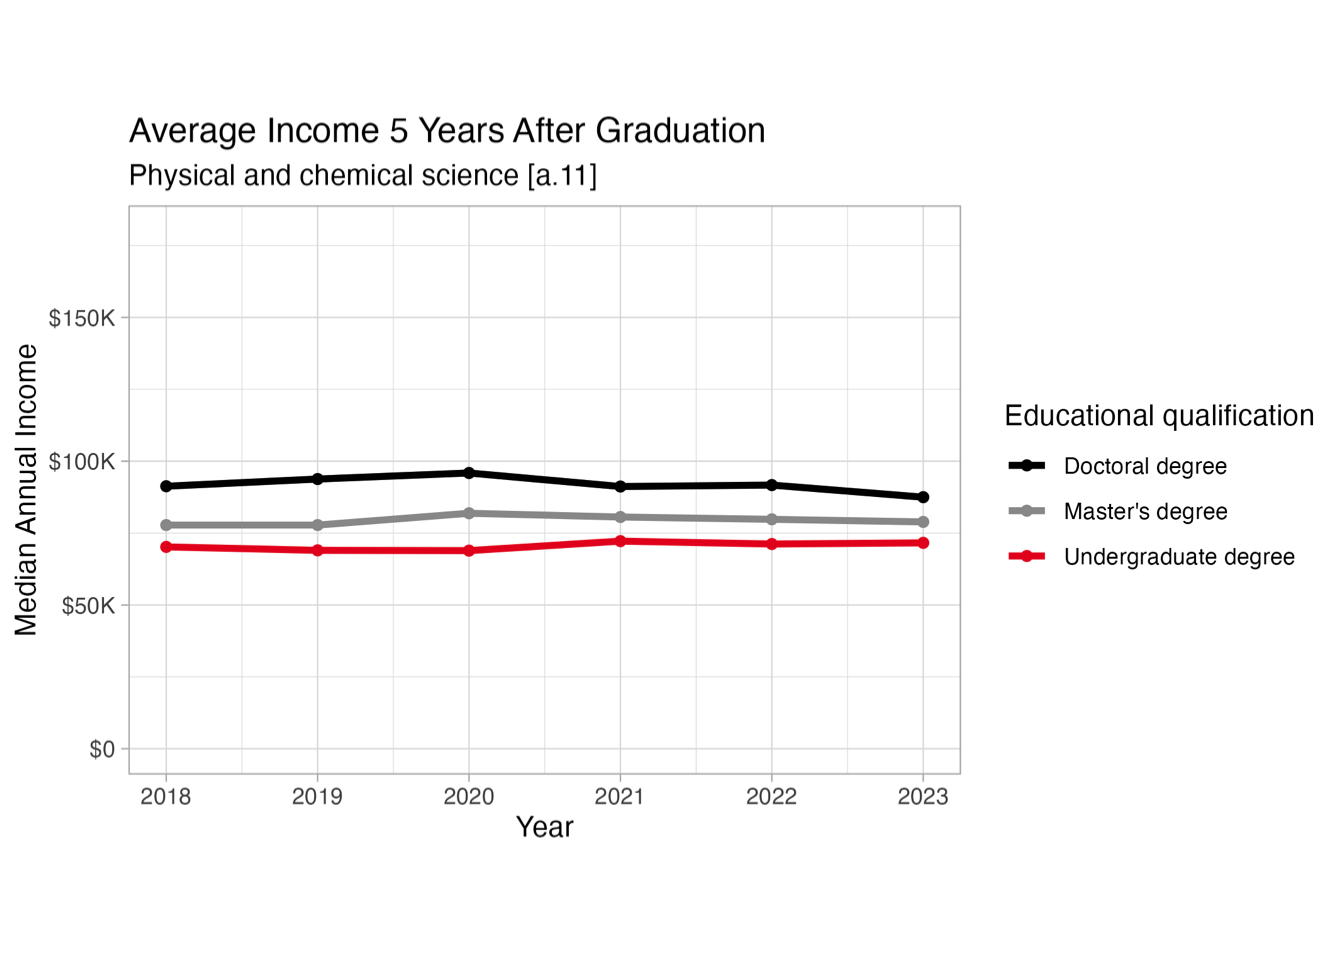
Example degrees in Physical and chemical sciences [a.11]
This group includes:
- Soil chemistry and physics
- Atmospheric sciences and meteorology
- Chemistry
- Geological and Earth sciences/geosciences
- Physics
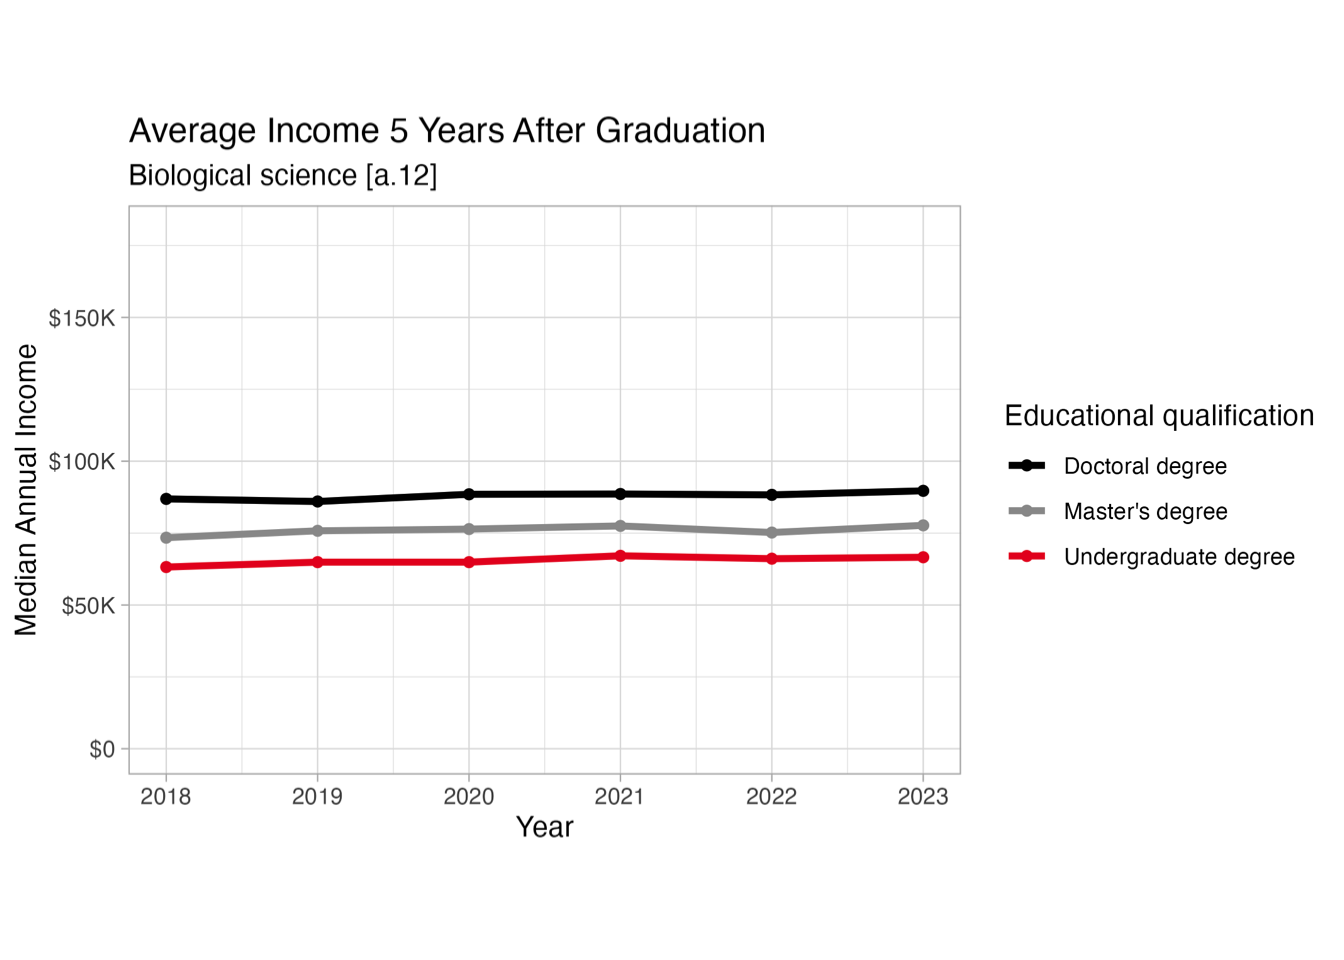
Example degrees in Biological science [a.12]
This group includes:
- Animal sciences
- Food science and technology
- Biological and biomedical sciences
- Biomathematics, bioinformatics, and computational biology
- Biotechnology
- Microbiological sciences and immunology
- Nutrition sciences
- Cognitive psychology and psycholinguistics
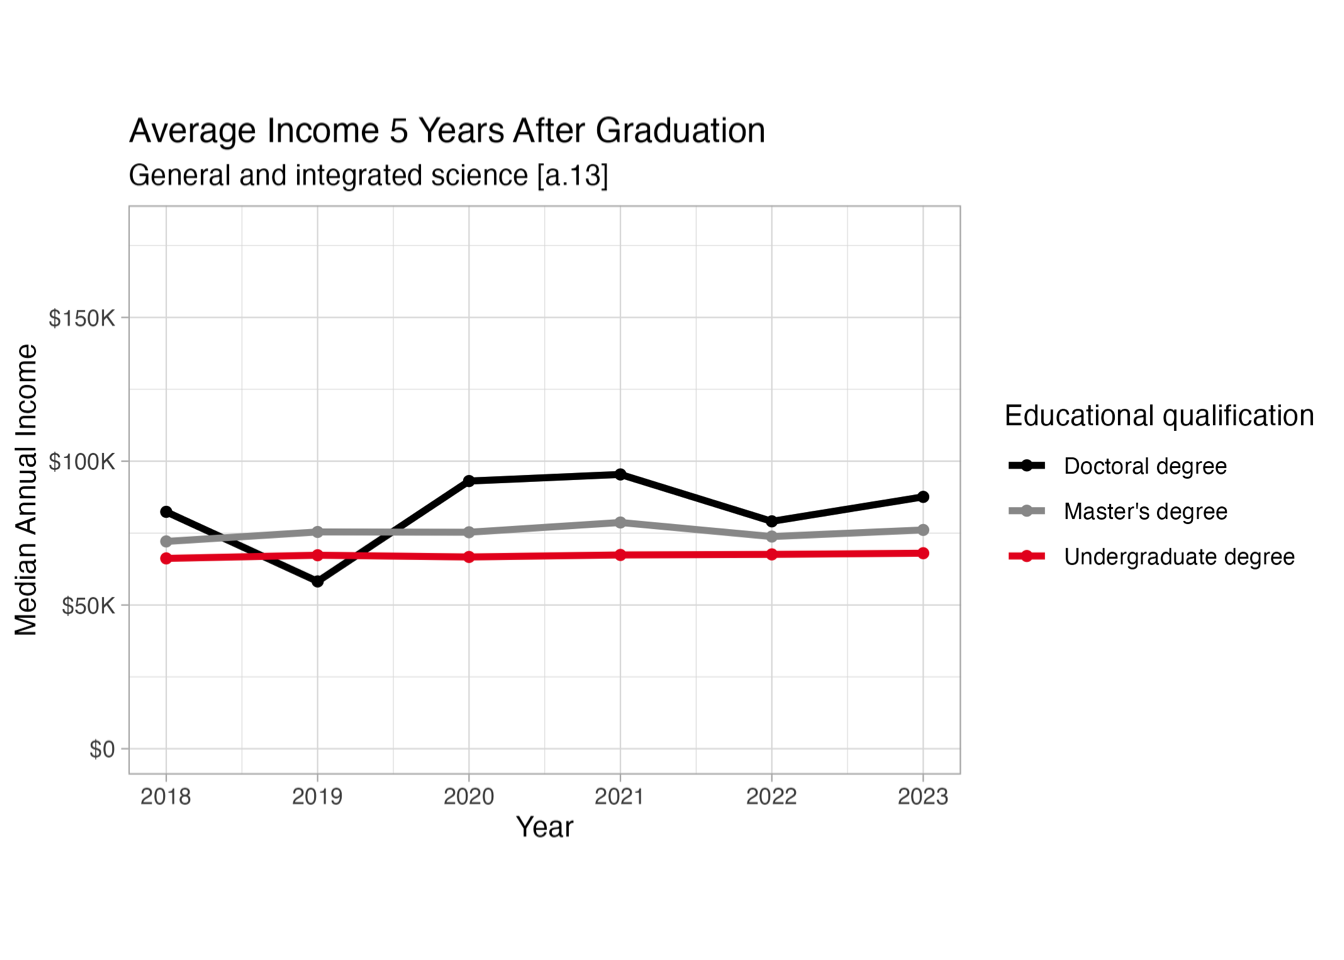
Example degrees in General and integrated science [a.13]
This group includes:
- Range science and management
- Soil science and agronomy, general
- Environmental science
- Cognitive science
- Forensic science
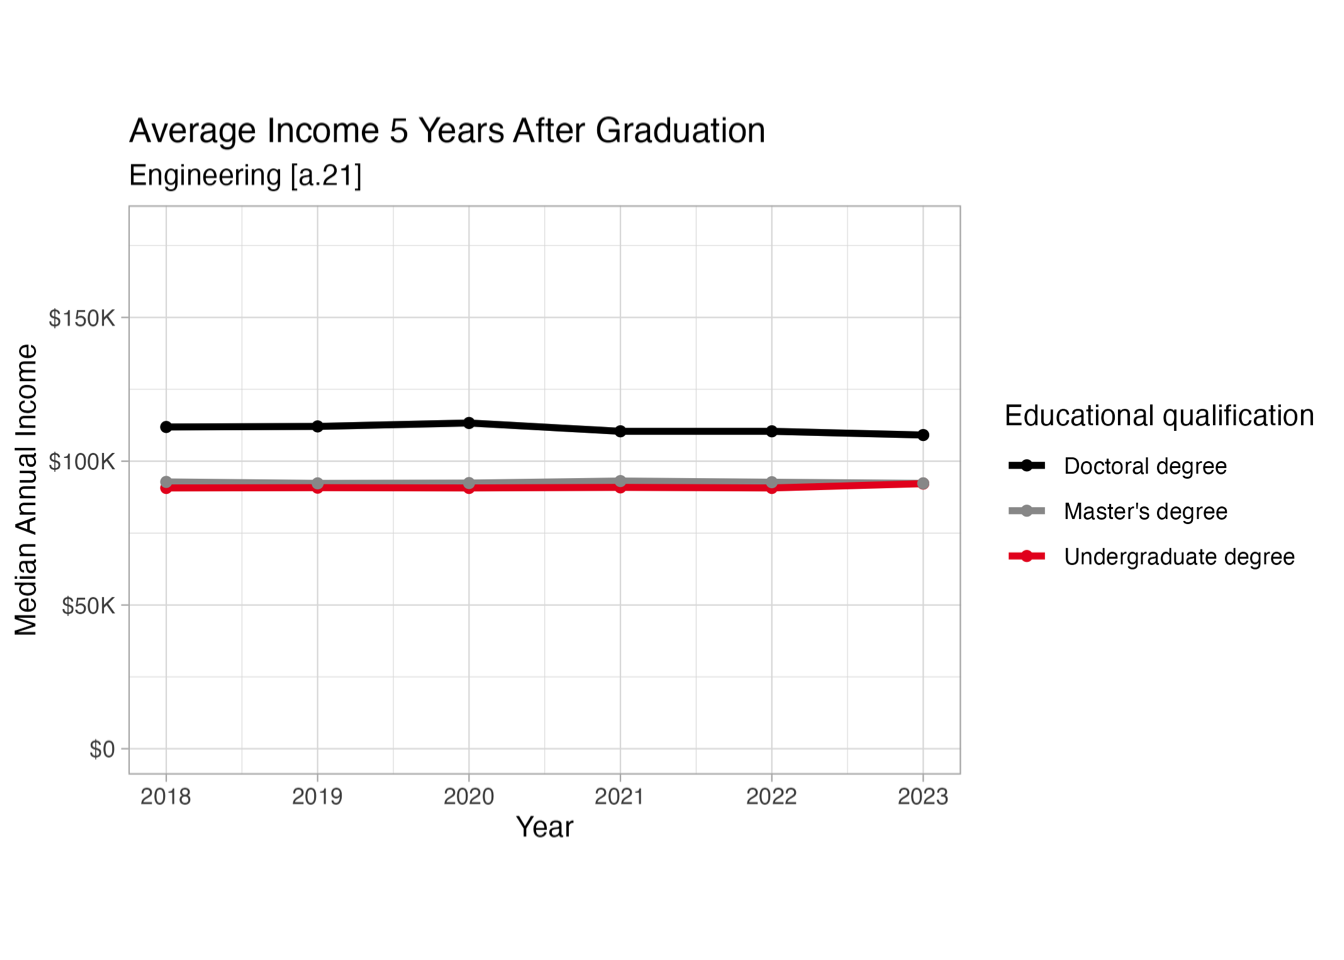
Example degrees in Engineering [a.21]
This group includes:
- Aerospace, aeronautical and astronautical/space engineering
- Chemical engineering
- Civil engineering
- Computer engineering
- Mechanical engineering
- Mining and mineral engineering
- Geological/geophysical engineering
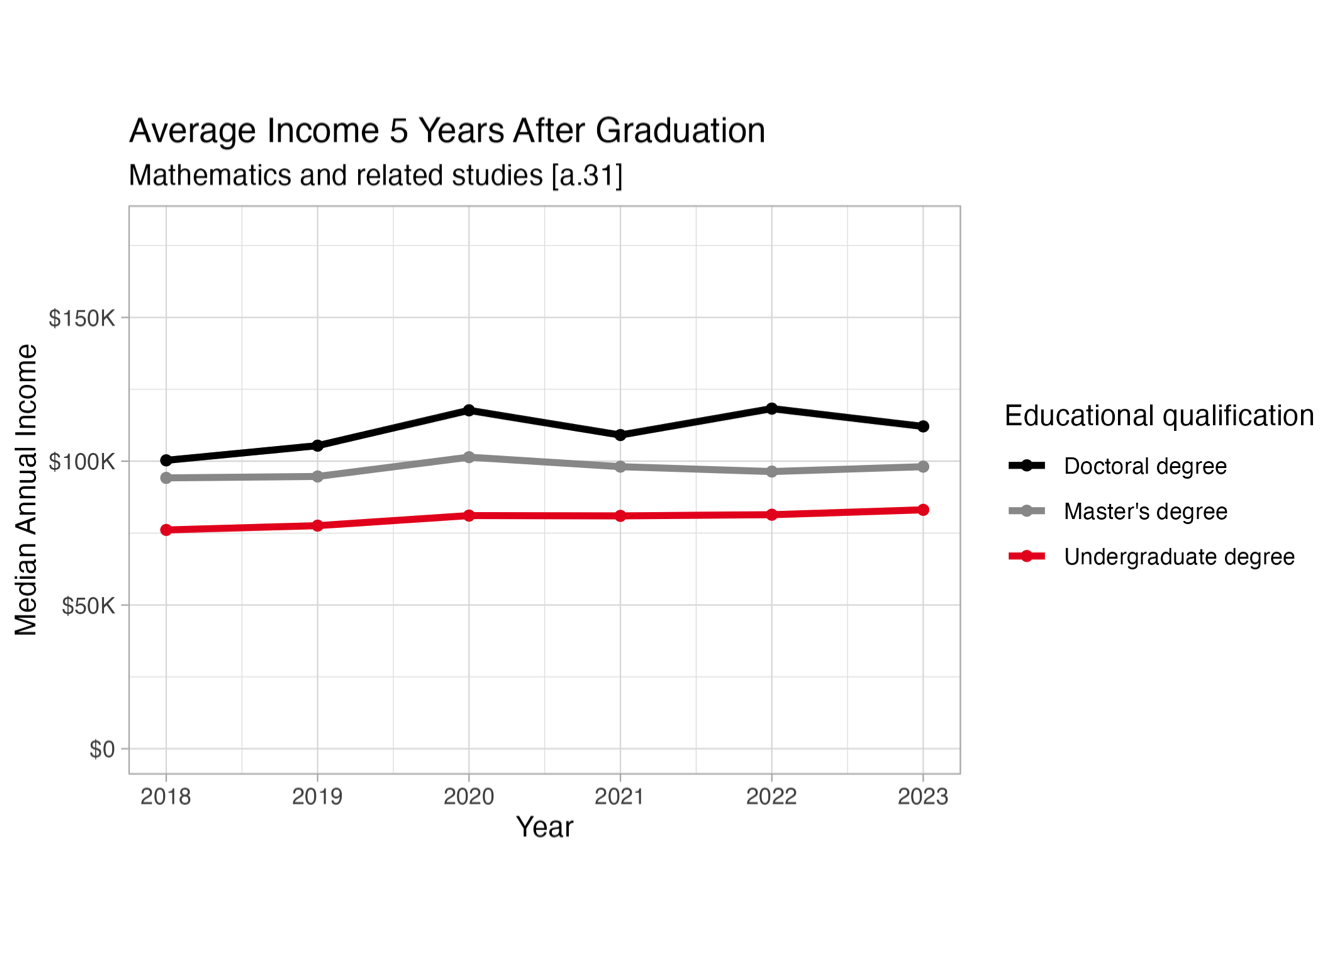
Example degrees in Mathematics and related studies [a.31]
This group includes:
- Applied mathematics
- Actuarial science
- Mathematics
- Statistics
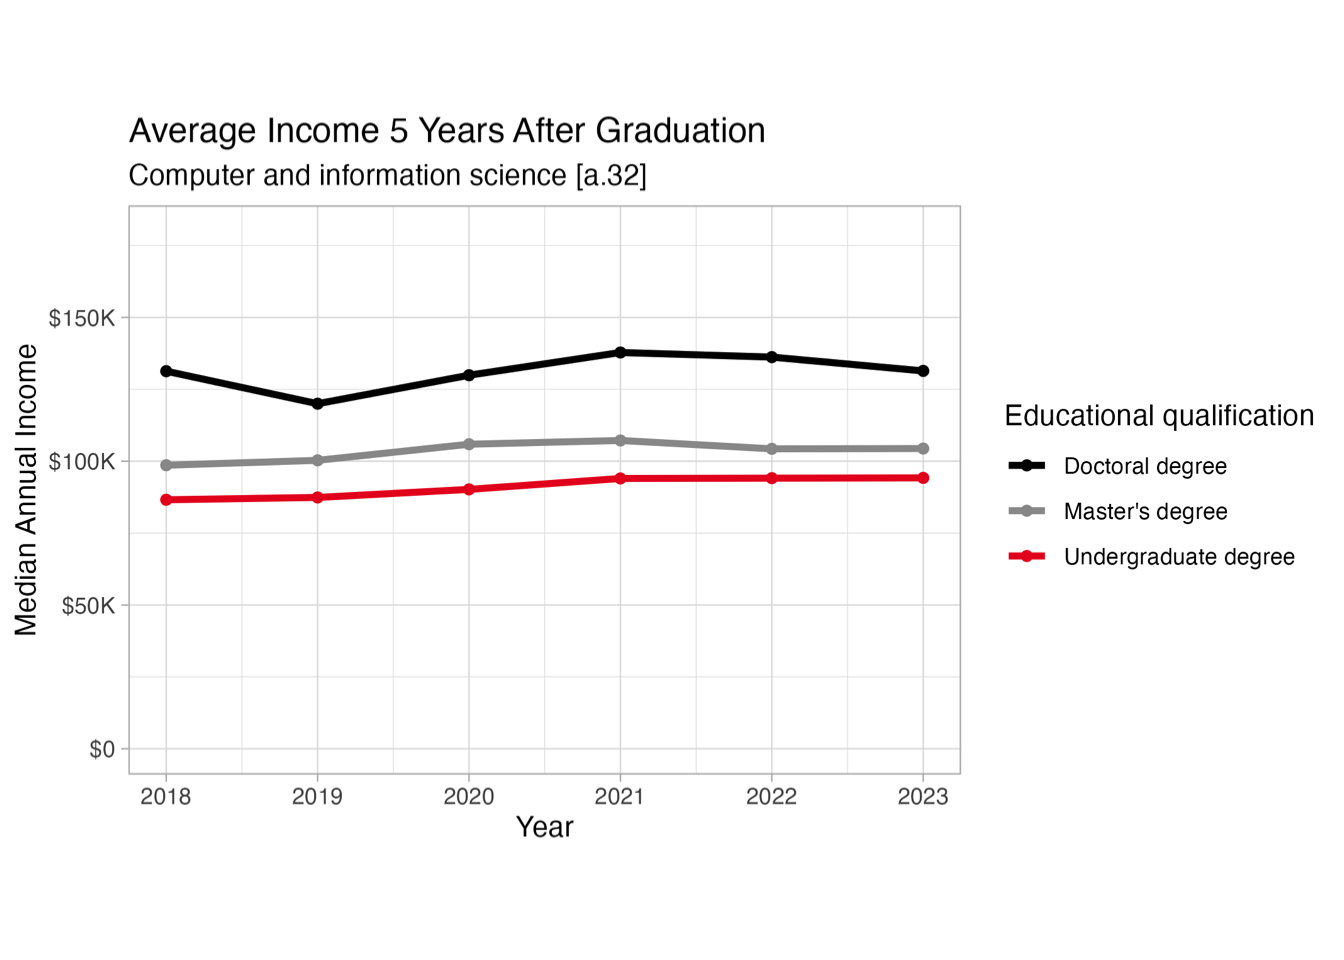
Example degrees in Computer and information sciences [a.32]
This group includes:
- Computer programming
- Data processing and data processing technology/technician
- Data modelling/warehousing and database administration
- Human computer interaction
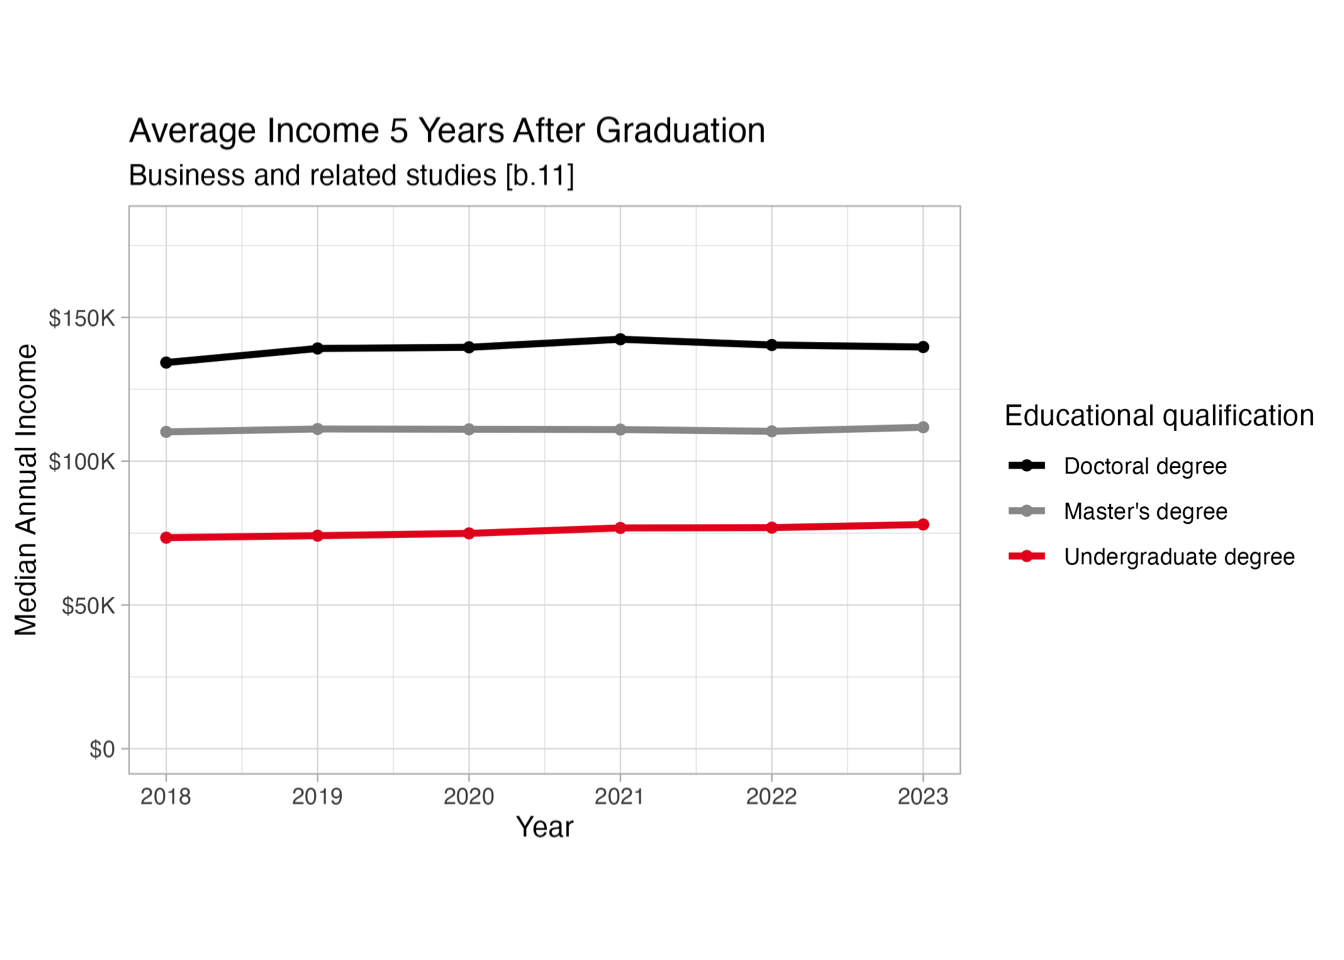
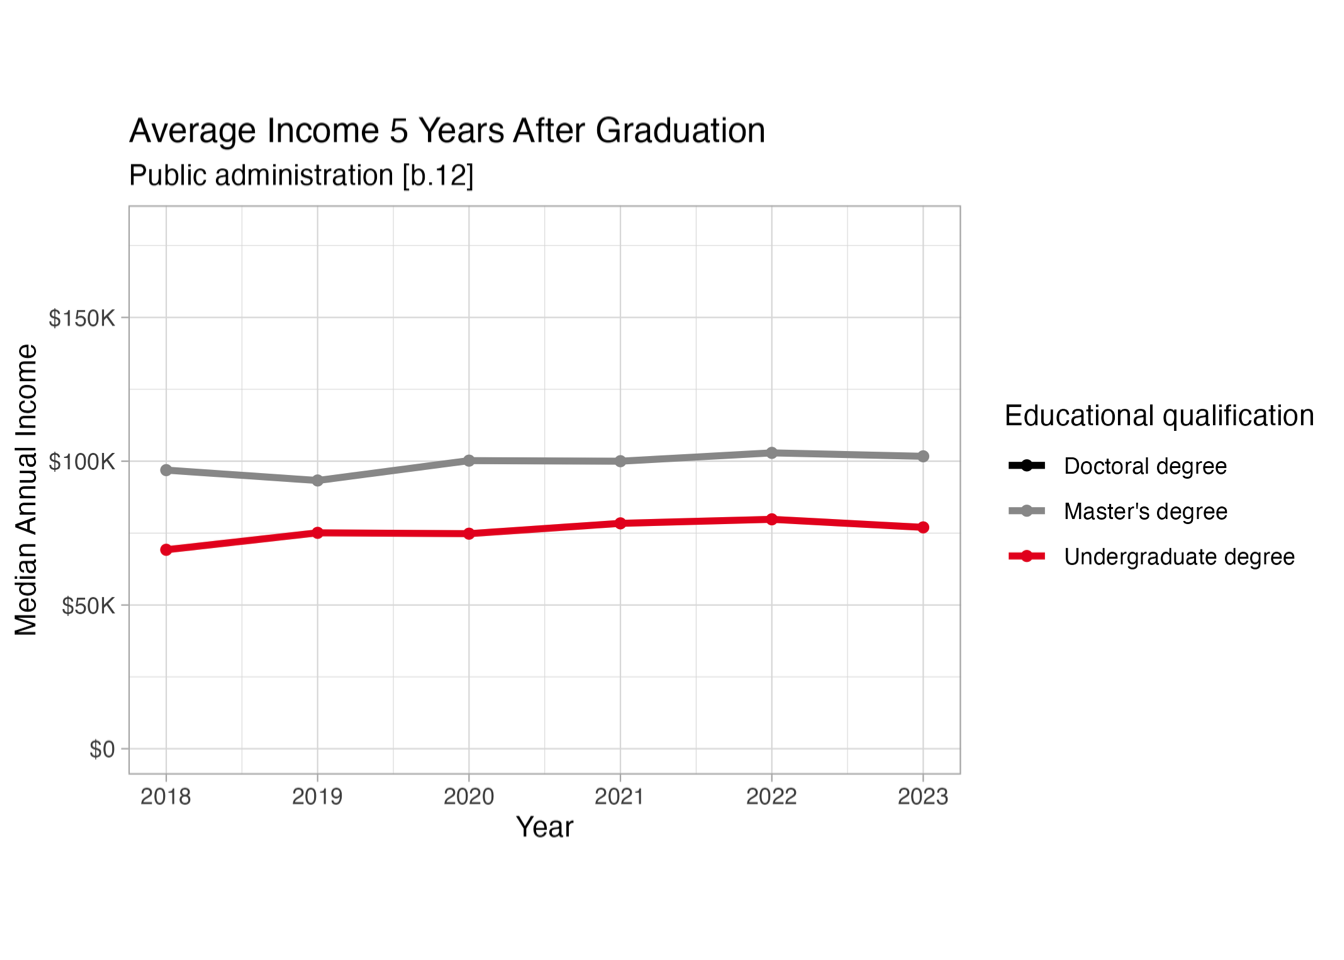
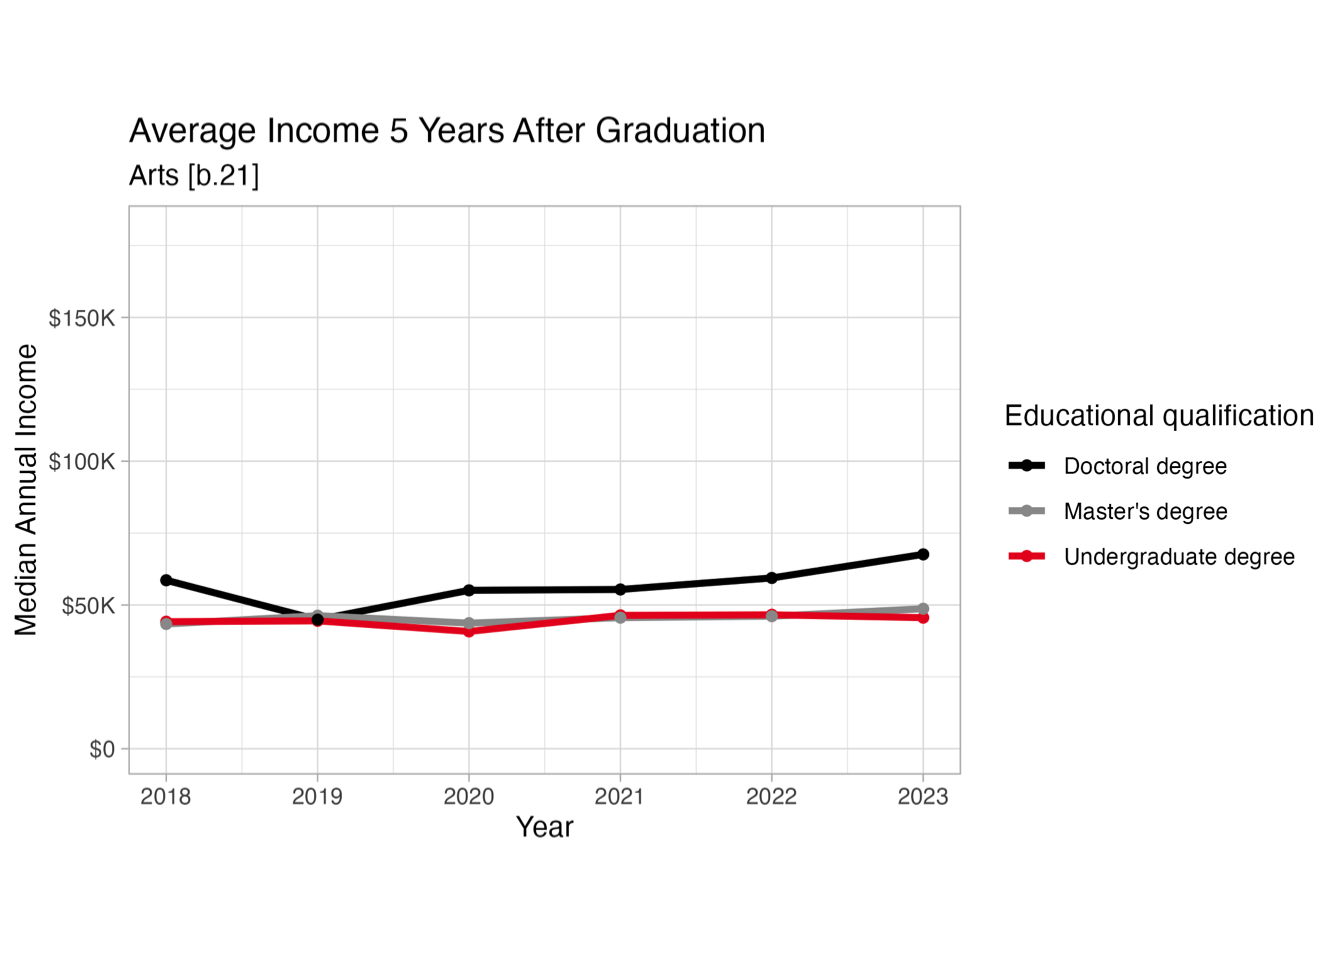
How much is the premium for an advanced degree based on salaries 5 years after graduation?
Comparing the median annual income for graduates with Bachelor, Masters, and Doctoral degrees across fields using constant 2023 dollars. Salaries are by the Classification of Instructional Programs (2016)
Data source
Statistics Canada. Table 37-10-0282-01 Characteristics and median employment income of postsecondary graduates five years after graduation, by educational qualification and field of study (STEM and BHASE groupings) https://doi.org/10.25318/3710028201-engCategorization of Educational Programs
The 2016 Classification of Instructional Programs (CIP) is used to classify the main field of study of postsecondary programs into STEM and BHASE groupings. https://www150.statcan.gc.ca/n1/pub/37-20-0001/372000012024001-eng.htm
In order to split graduates into different degree classifications that are comparable across levels, some pooling of degrees is required.
This group includes:
- Accounting
- Business/commerce
- Business administration, management and operations
- Business Economics, Financial Economics, and Management Economics
- Entrepreneurship/entrepreneurial studies
- Finance
- Human resources management
- International business/trade/commerce
- Marketing
This group only includes public administration degrees.
This group includes:
- Audiovisual communications technologies/technicians
- Visual and performing arts
- Dance
- Drama/theatre arts and stagecraft
- Music
This group includes:
- Aboriginal and foreign languages, literatures and linguistics
- English language and literature/letters
- Humanities/humanistic studies
- Medieval and renaissance studies
- Philosophy and religious studies
- History
This group includes:
- Area, ethnic, cultural, gender, and group studies
- Communication, journalism and related programs
- Work and family studies
- Gerontology
- Behavioural sciences
- Psychology, general
- Public policy analysis (except cannabis)
- Social sciences, general
- Archaeology
- Criminology
- Economics
- Political science and government
- Sociology
This group includes:
- Law (LLB, JD, BCL)
- Non-professional general legal studies (undergraduate)
- Legal support services
This group includes:
- Registered nursing, nursing administration, nursing research and clinical nursing
- Practical nursing, vocational nursing and nursing assistants
This group includes:
- Education, general
- Educational administration and supervision
- Student counselling and personnel services
- Teaching English or French as a second or foreign language
This group includes:
- Social work
- Community organization and advocacy
- Youth services/administration
This group includes:
- Soil chemistry and physics
- Atmospheric sciences and meteorology
- Chemistry
- Geological and Earth sciences/geosciences
- Physics
This group includes:
- Animal sciences
- Food science and technology
- Biological and biomedical sciences
- Biomathematics, bioinformatics, and computational biology
- Biotechnology
- Microbiological sciences and immunology
- Nutrition sciences
- Cognitive psychology and psycholinguistics
This group includes:
- Range science and management
- Soil science and agronomy, general
- Environmental science
- Cognitive science
- Forensic science
This group includes:
- Aerospace, aeronautical and astronautical/space engineering
- Chemical engineering
- Civil engineering
- Computer engineering
- Mechanical engineering
- Mining and mineral engineering
- Geological/geophysical engineering
This group includes:
- Applied mathematics
- Actuarial science
- Mathematics
- Statistics
This group includes:
- Computer programming
- Data processing and data processing technology/technician
- Data modelling/warehousing and database administration
- Human computer interaction
Footnotes
The Education and Labour Market Longitudinal Platform (ELMLP) provides occasional reports on the post-secondary sector.↩︎